Epilepsy research: Do brain abnormalities change over time?
The full details for this project are available in our open access paper, Temporal stability of intracranial electroencephalographic abnormality maps for localizing epileptogenic tissue. My Python code for generating the main figures is available on my GitHub.
Overview
When seizures are not controlled by medication, one of the few remaining treatment options is brain surgery to remove the part of the brain that causes seizures. However, identifying those regions can be difficult, and people with epilepsy often continue having seizures after surgery. The main focus of my postdoc research is developing computational measures that help pinpoint pathological brain regions so that they can successfully be removed.
This study investigated the stability of one of our measures of brain “abnormalities” that we use to identify pathological brain regions. Our measure is computed from intracranial EEG, which is recorded from electrodes that are temporarily implanted directly on or in the brain. These recordings are usually multiple days and capture a variety of brain activity, including periods of sleep, wake, and seizures. To use our abnormality measure clinically, we first need to know whether the measure is robust. How much is it influenced by the type of brain activity? How much data is needed to reliably compute our measure?
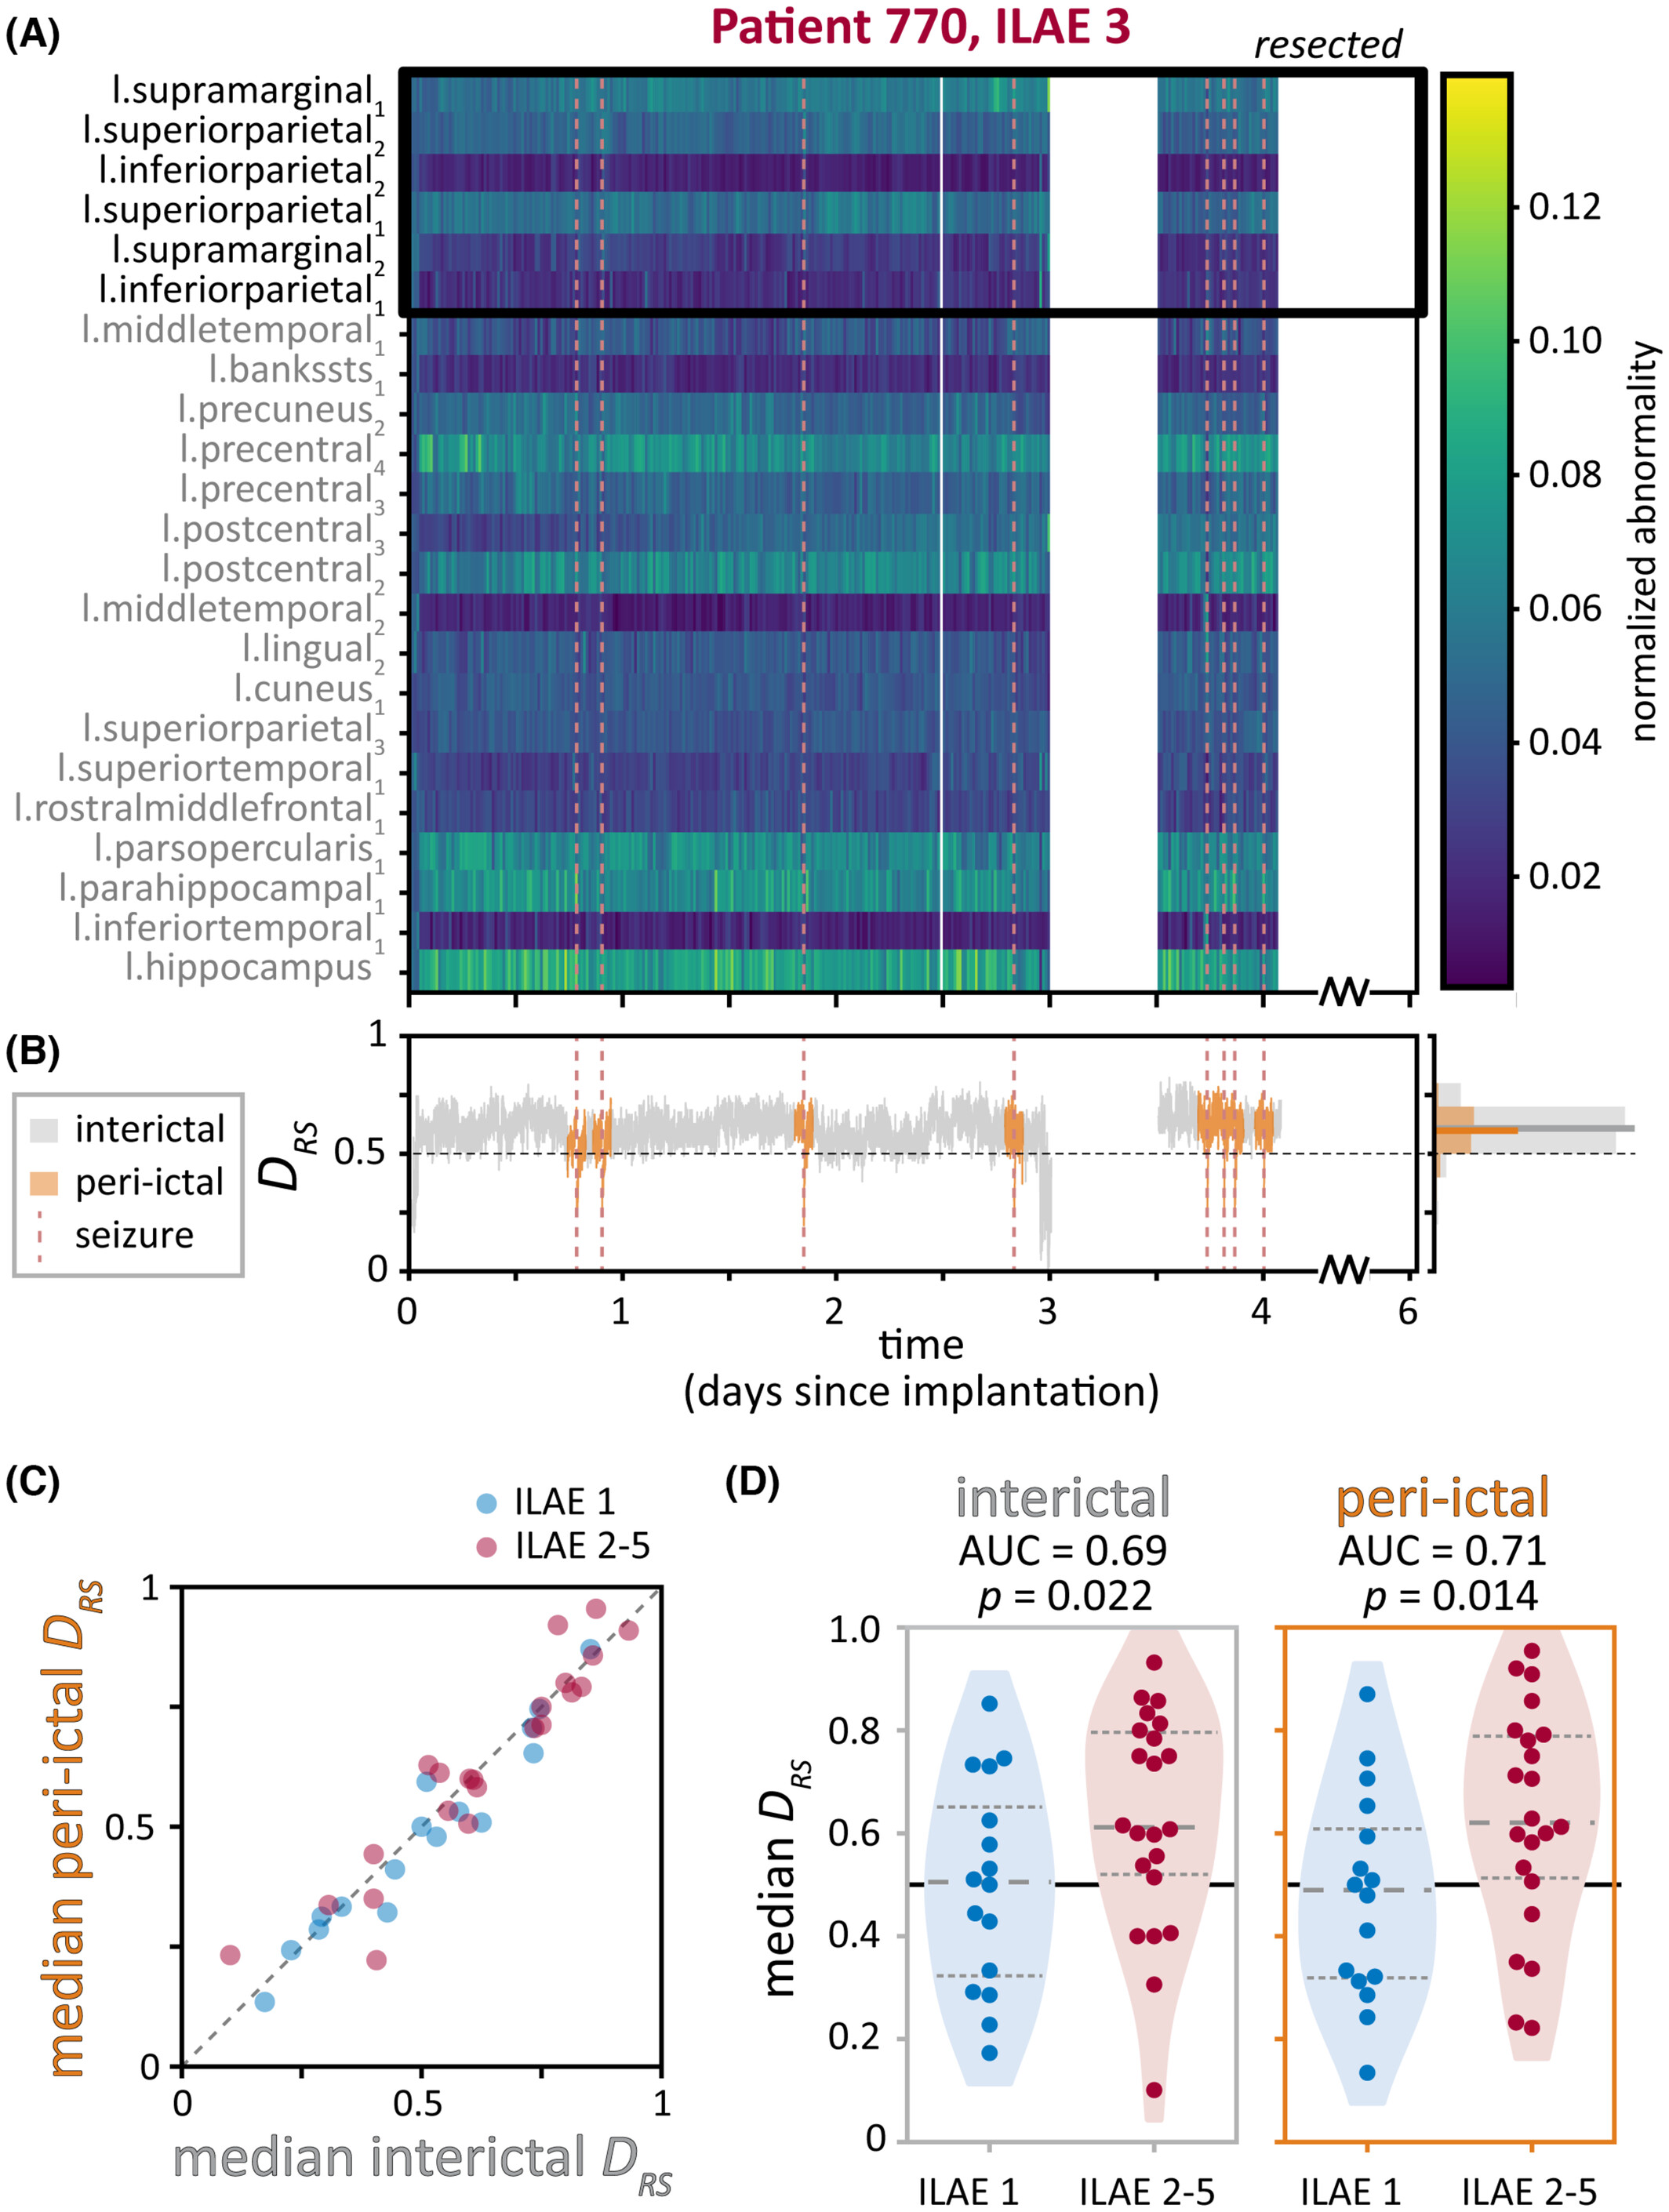
To determine the impact of removing brain abnormalities, we additionally computed a summary metric, DRS, that captures differences in abnormality levels between the resected (i.e., hypothesised to be pathological) and spared (thought to be healthy) brain regions. We expected DRS to differ depending on whether the subject was seizure free after surgery – indicating that the hypothesised pathological regions indeed caused seizures – or not seizure free.
We found that although there is some variability in abnormalities at the level of different brain regions, the relationship between resected and spared brain regions (as captured by the metric DRS) remained relatively consistent over time in each subject. Additionally, we could use DRS to distinguish subjects that were seizure free versus not seizure free after surgery.
We used a variety of plots to visualise the data at the level of individual subjects as well as the entire cohort - I’ve included a couple examples here. This figure shows that brain abnormalities and the summary DRS metric were similar in time periods close to seizures (“peri-ictal”) and far away from seizures (“interictal”). Subjects were divided by whether they had good (ILAE 1, blue) or poor (ILAE 2-5, red) treatment outcomes.
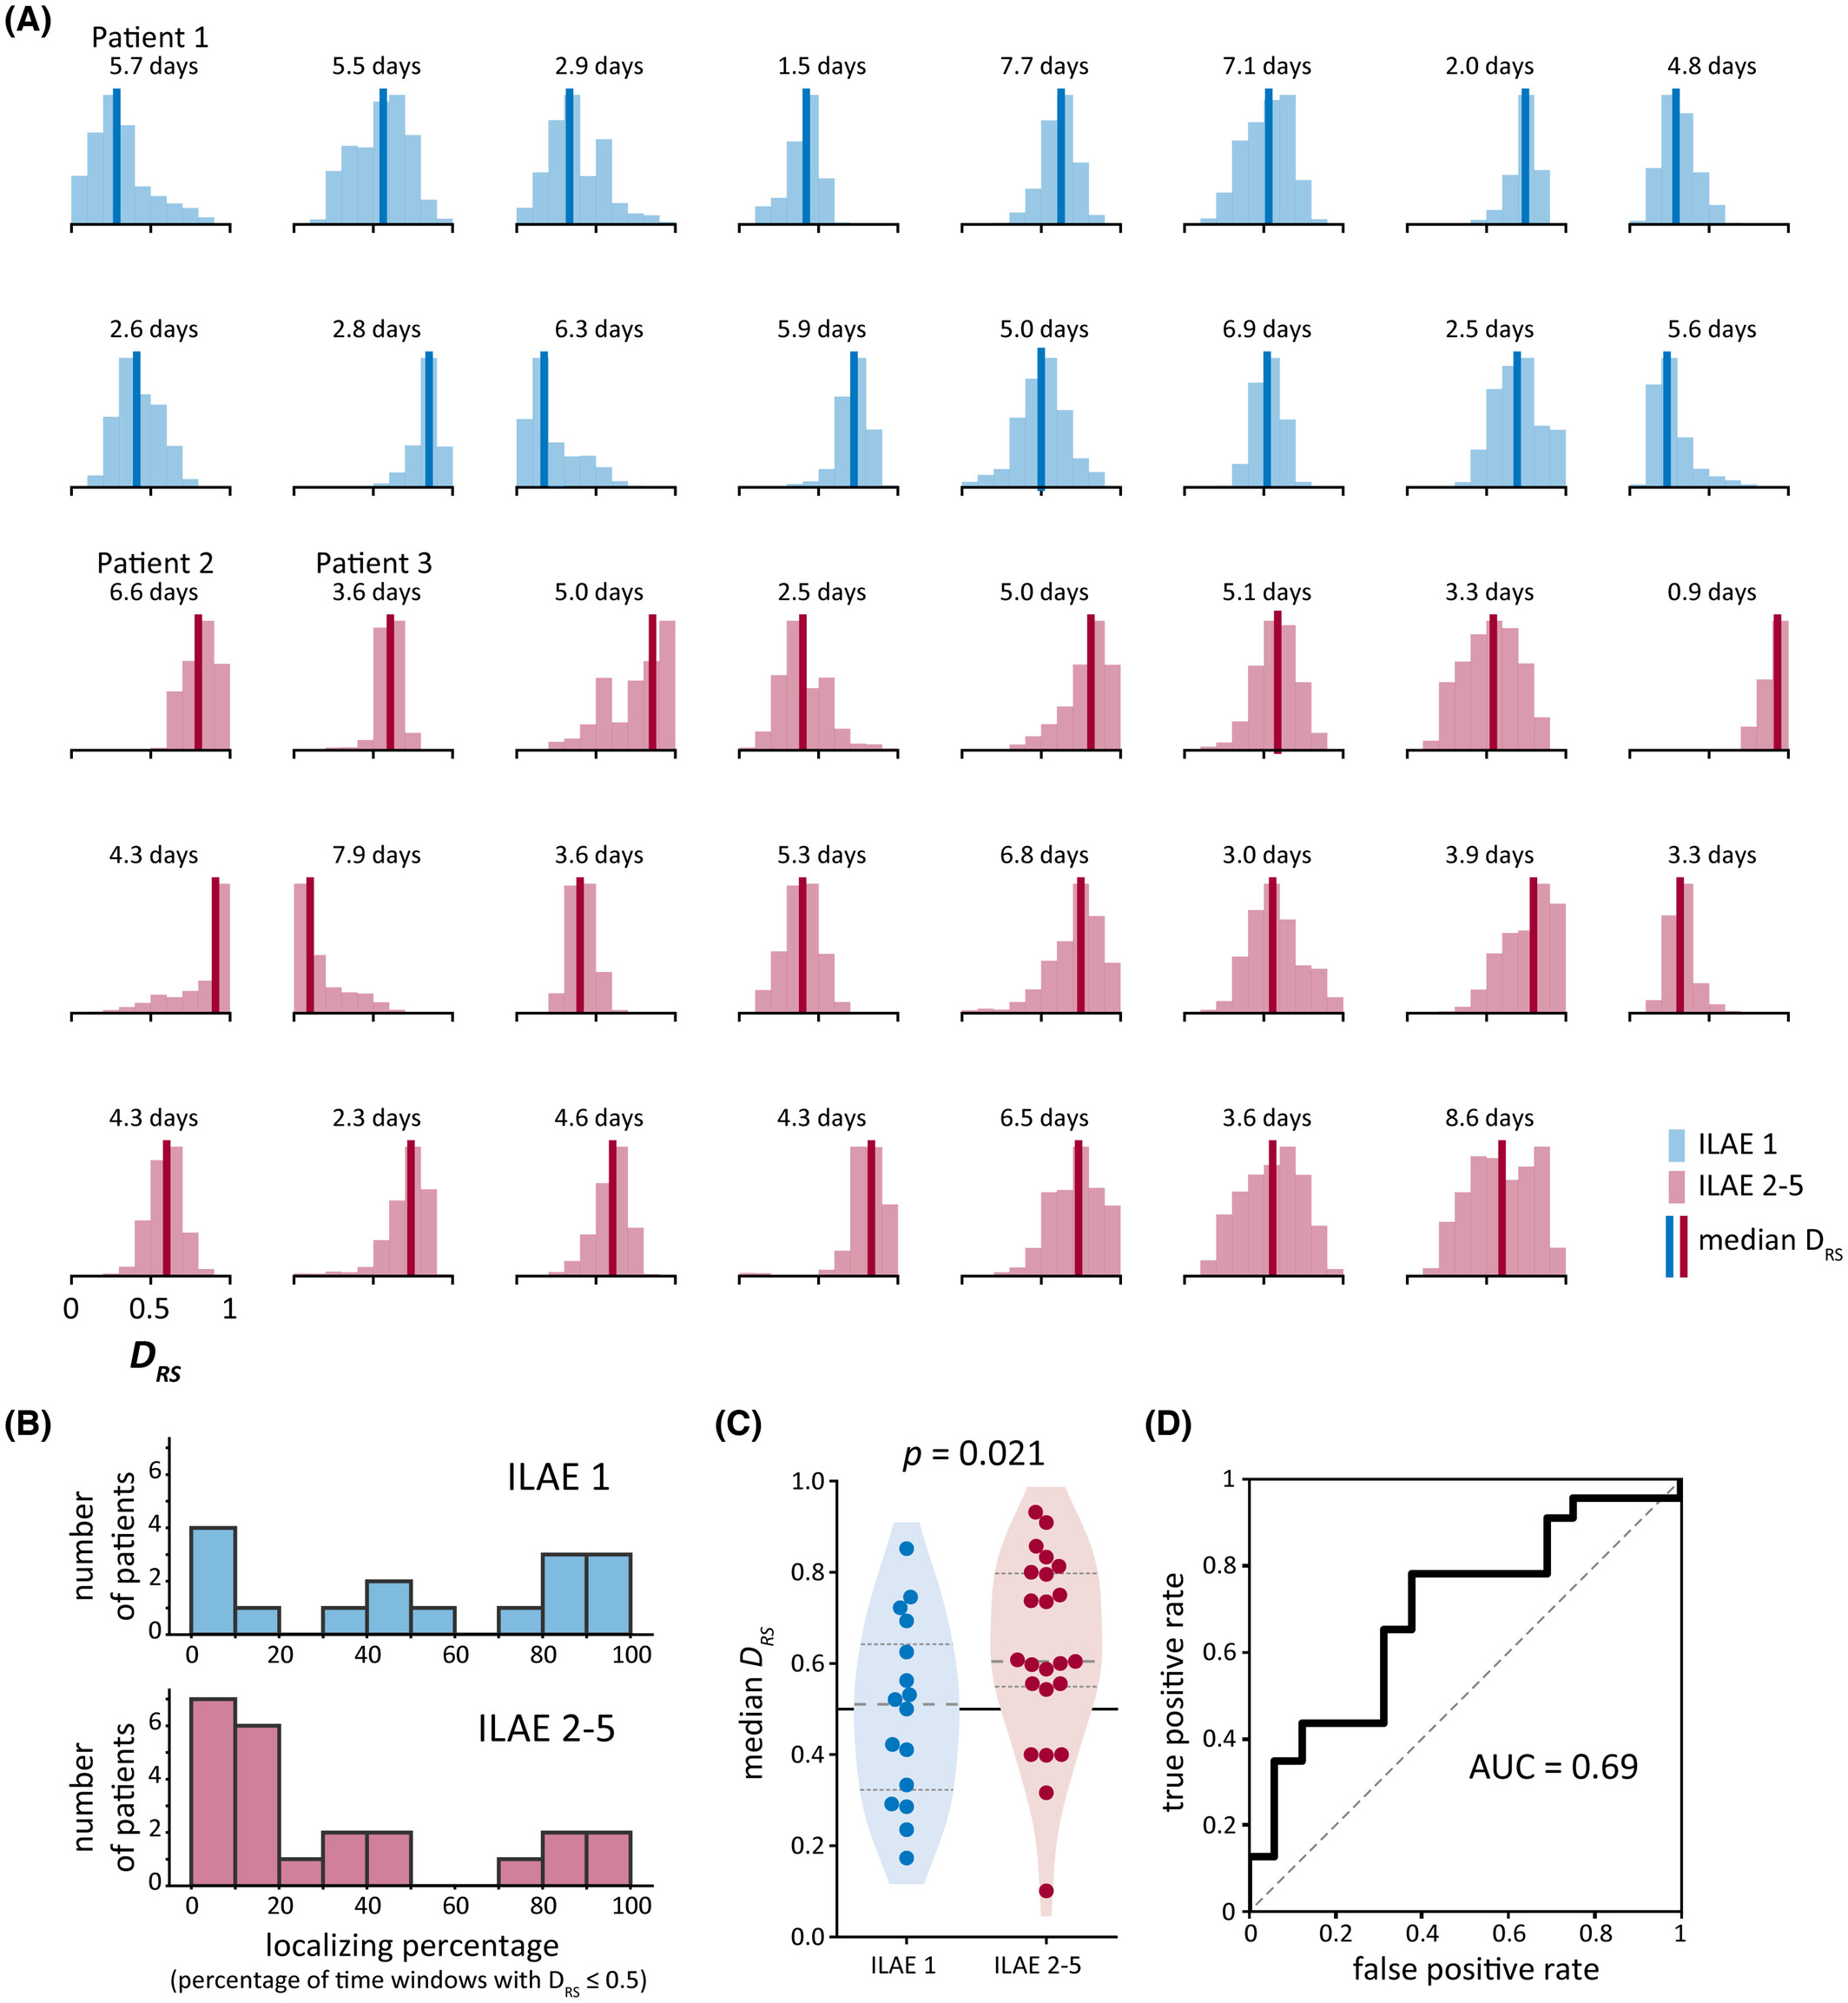
The figure below summarises results across subjects. We show the distribution of our summary measure in each subject and then used a machine learning classification metric to evaluate whether our measure distinguished subjects by their surgical outcomes.
My contributions
This project was a collaborative effort between five members of the lab as well as our clinical collaborators. Throughout the project, we met regularly to discuss preliminary results and brainstorm next steps. I was heavily involved in the analysis and writing. I worked with two other lab members to process and analyse the brain recording data, then drafted the manuscript’s methods, results, and supplementary material. I also generated most of the figures and final documented code, with feedback from the group.
Data science approaches
Data wrangling: Our lab has collaboratively created a large database of iEEG data along with patient, recording, and brain region metadata. A subset of this data was used and further organised for this project.
Signal processing and time series frequency decomposition: We analysed brain activity in the frequency domain by computing power spectral densities and band power.
Normative mapping: To determine if brain regions were abnormal, we compared brain activity in each patient to a normative map of our measure. This map describes normal brain dynamics in each brain region and was created using non-pathological brain regions from over 200 subjects from a separate iEEG study. Importantly, the normative map accounts for the well-known spatial variability in brain activity, allowing us to compare brain regions with different expected profiles of activity.
Machine learning classification metrics: We defined our summary measure, DRS, as the area under the curve (AUC) for distinguishing resected and spared brain regions using abnormalities. We also used AUC to quantify whether DRS distinguishes patients who had good versus poor treatment outcomes.
Non-parametric statistics: We used Wilcoxon rank sum tests to test whether our metric DRS significantly different between patients with good and patients with poor treatment outcomes.
Dimensionality reduction and time series decomposition: As part of the exploratory phase of this project, we also used approaches such as non-negative matrix factorisation and empirical mode decomposition to investigate possible spatiotemporal patterns in patient abnormalities.