Epilepsy research: Variability in seizure pathways
This work is published in Seizure pathways change on circadian and slower timescales in individual patients with focal epilepsy and Multiple mechanisms shape the relationship between pathway and duration of focal seizures.
Overview
Although it is well-established that brain dynamics vary over time, we are just beginning to understand how that variability impacts neurological disorders. In people with epilepsy, fluctuations in brain dynamics impact not only when seizures occur but also features such as symptoms and seizure spread. My PhD research focused on visualising and quantifying this variability, with ultimate goal of inspiring treatments that adapt to changing brain dynamics.
Quantitatively comparing seizures is challenging because seizures are such complex events. They have both spatial and temporal features: they change the activity of multiple brain regions, and that activity evolves from seizure start to finish. Seizures therefore need to be described using multivariate time series that capture spatiotemporal changes in brain dynamics. I described these time series as pathways through the space of possible brain dynamics.
I visualised seizure pathways in two dimensions using a dimensionality reduction technique that tries to maintain high dimensional distances in a lower dimensional space; it essentially squishes the data into two dimensions so that it’s easier to visually compare different observations. This representation isn’t perfect, but it’s a good way to start investigating the structure and relationships in complex data.
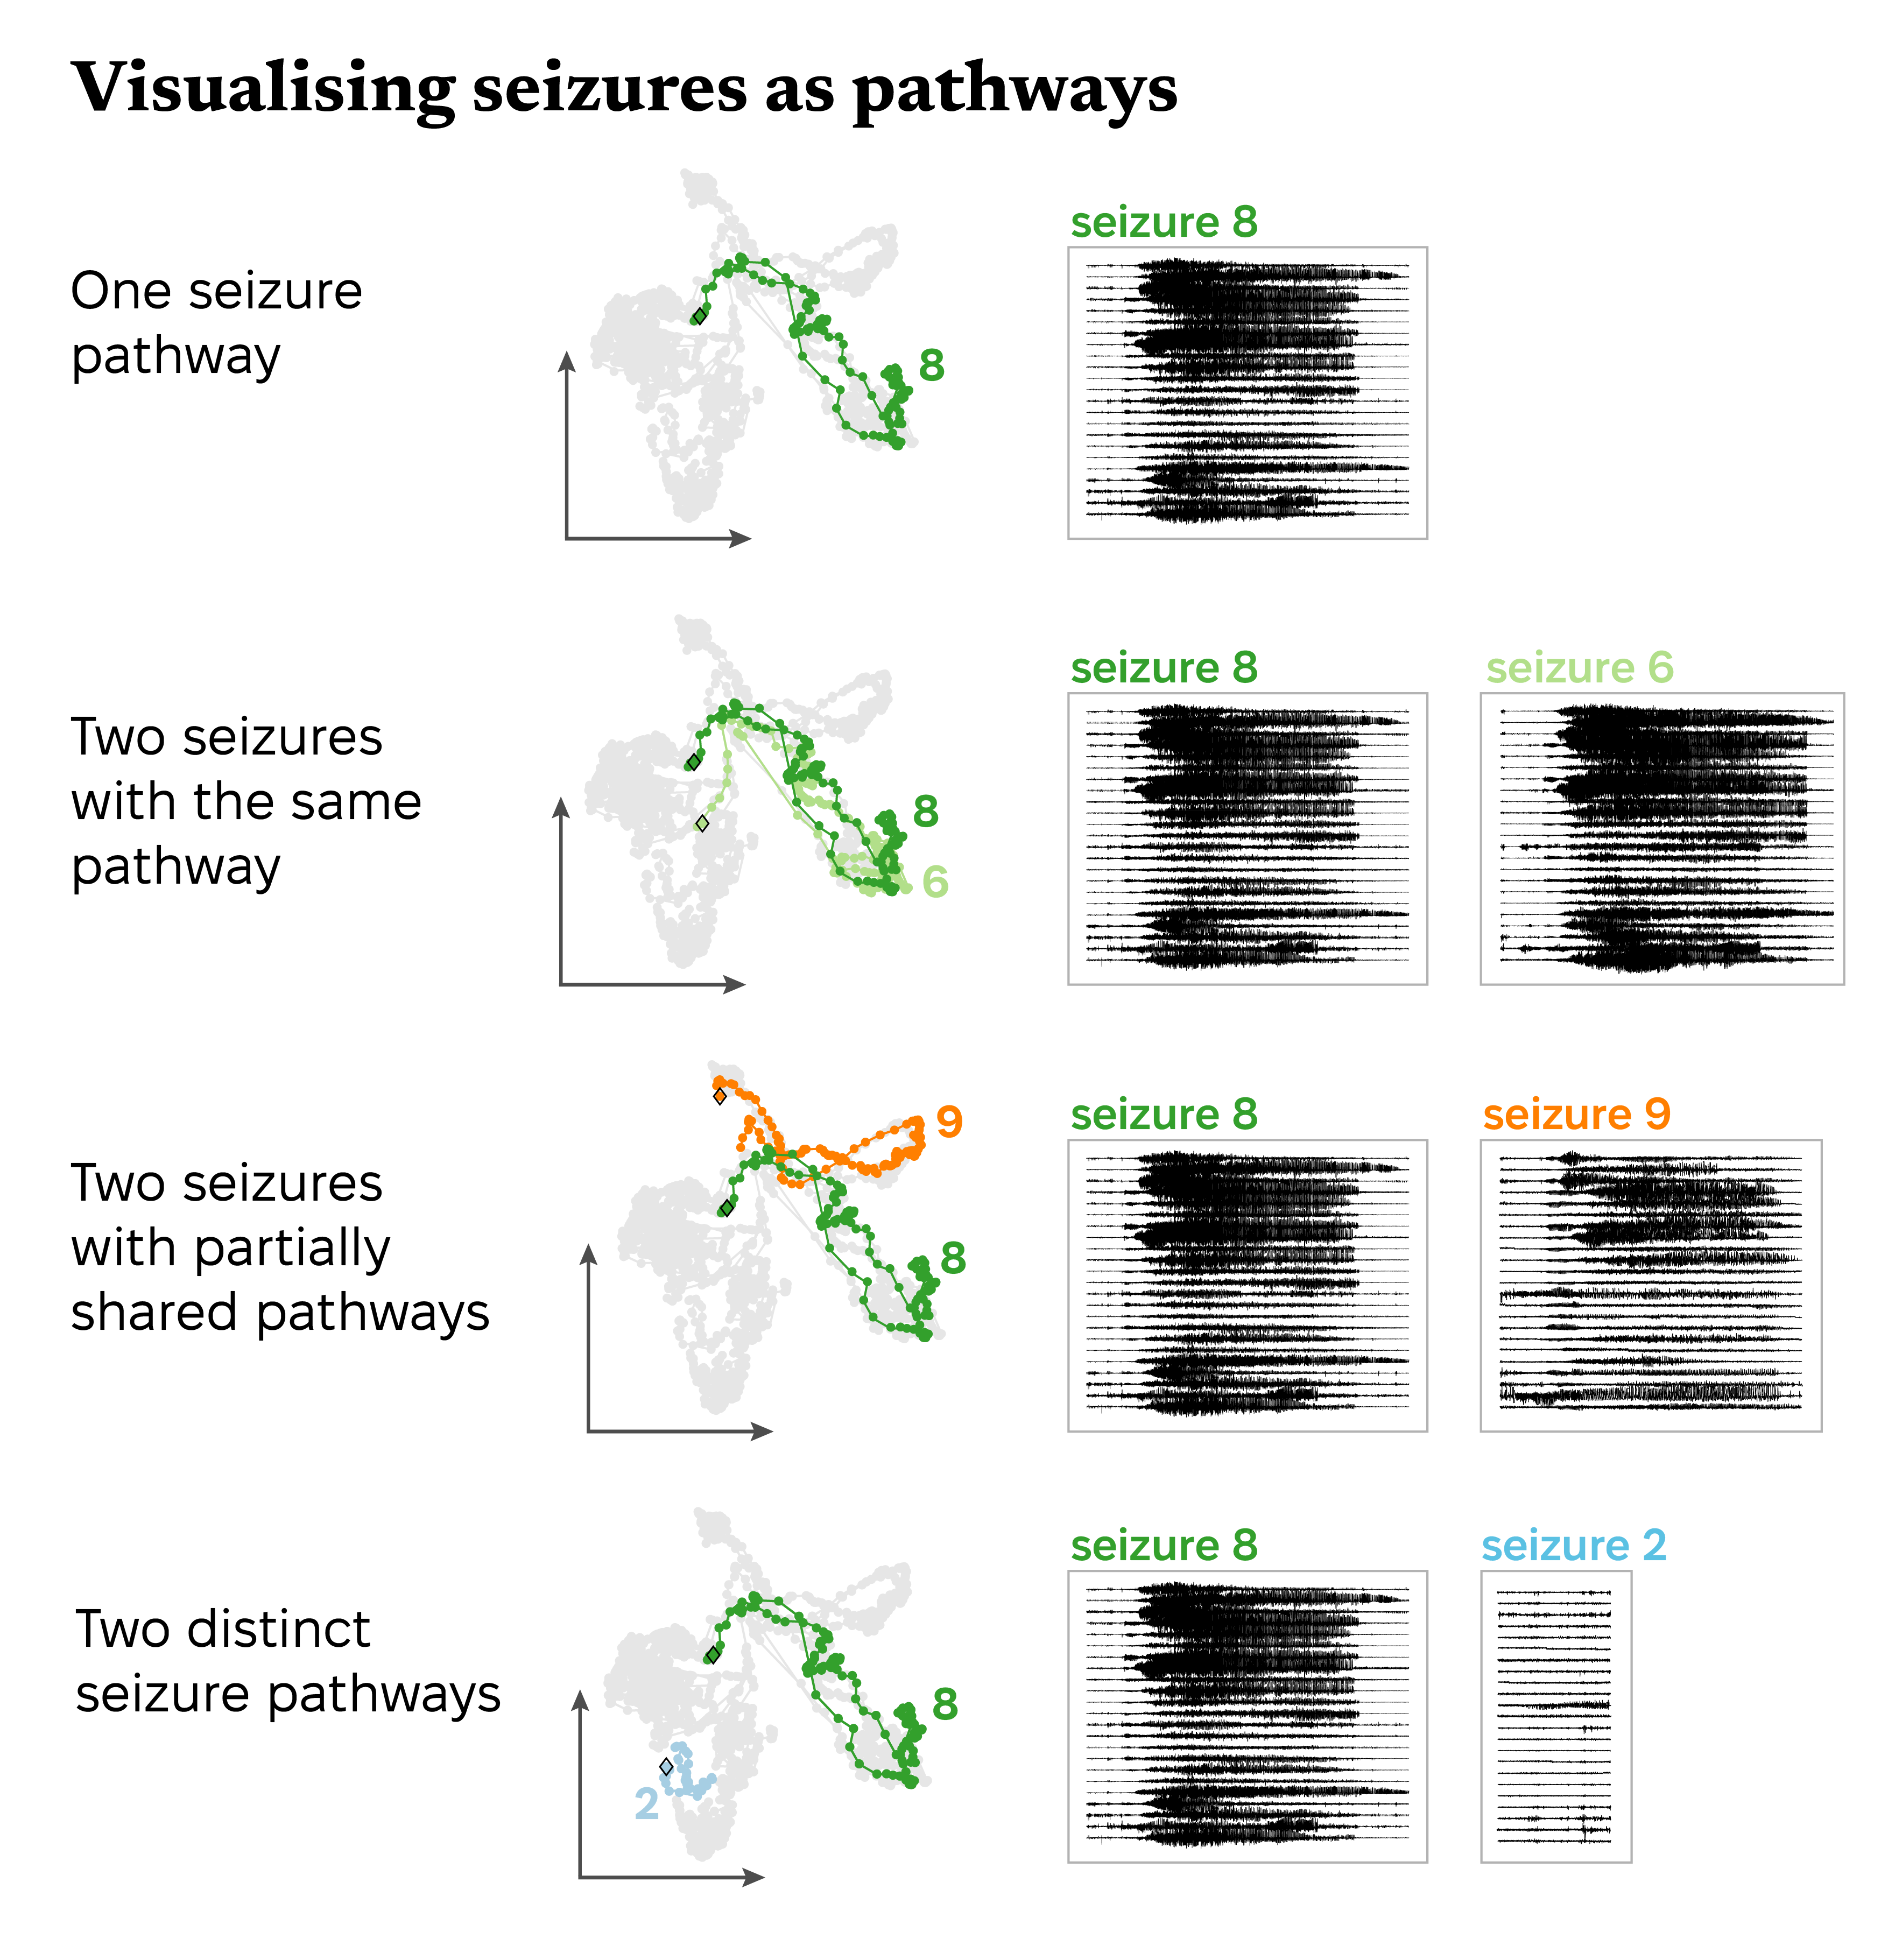
Here’s an example of this approach using one subject’s seizures. Each point represents the brain’s activity during a short part of a seizure. Points that are closer together represent similar patterns of brain activity. By connecting points in the same seizure, we see how brain activity changes during the seizure; this line is the seizure’s pathway.
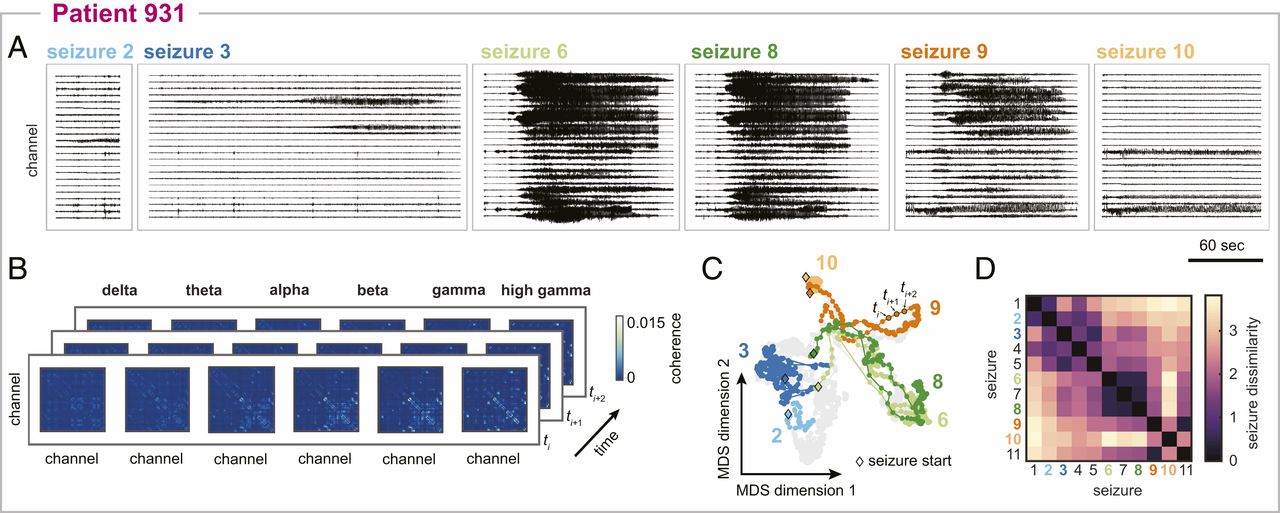
Here are more seizures from the same subject - you can see the seizure variability from both the brain recordings (A) and seizure pathways (C). I also quantified the “distance” or dissimilarity between each pair of pathways (D) to have an objective comparison of seizure pathways for downstream analysis.
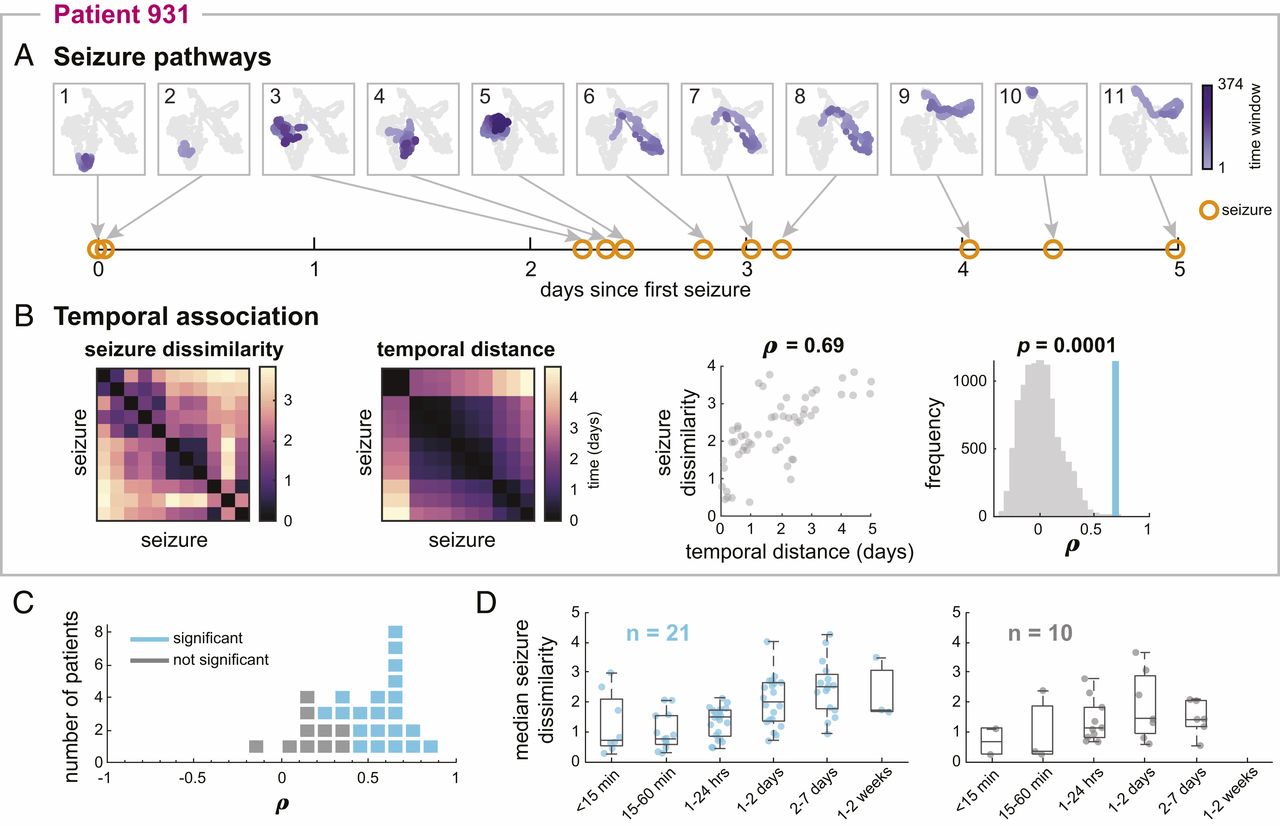
One of my first observations was that different types of seizure pathways do not occur randomly - instead, more similar seizures tended to occur close together in time. For example, in (A) below, the purple seizure pathways migrated through network space as time passed, with similar pathways (e.g., seizures 6-8) occurring back-to-back. The rest of the figure quantifies the relationship between seizure pathways and their “temporal distance”: the amount of time between each pair of seizures.
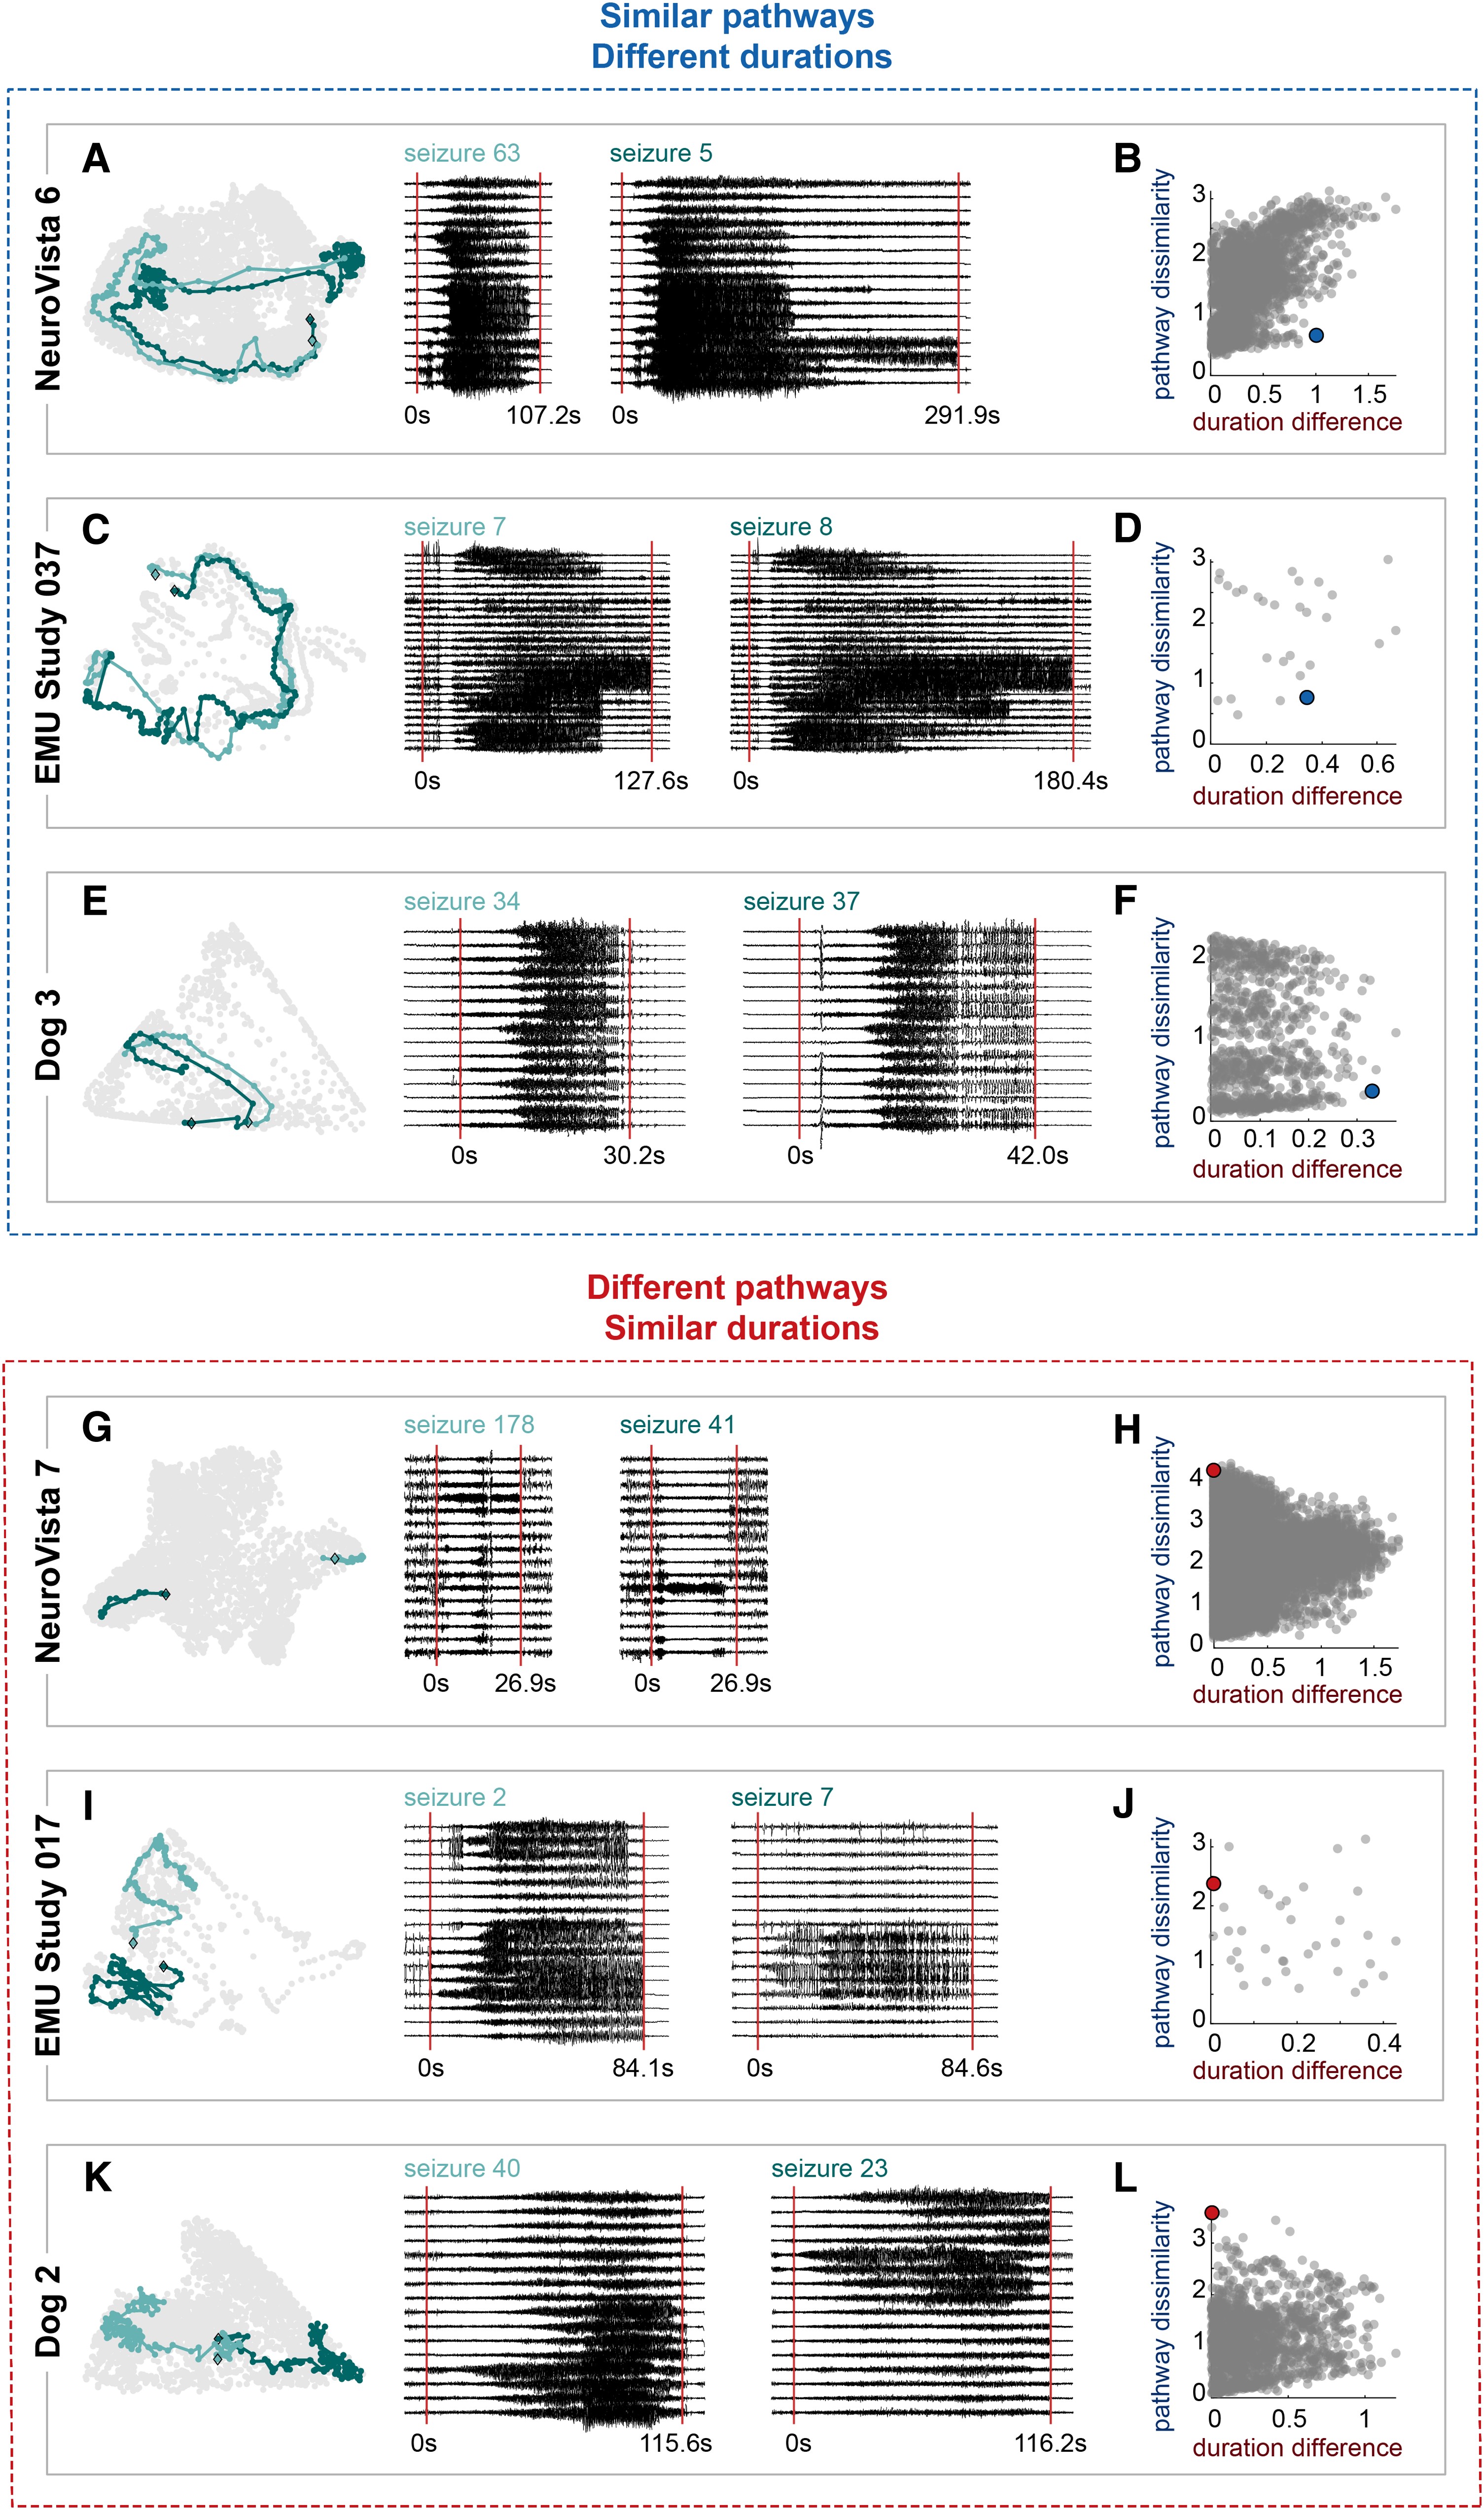
Importantly, quantifying seizure variability paves the way for additional studies by providing an objective measure of seizure (dis)similarity. For example, in my next study I asked if seizures with similar pathways also last a similar amount of time. I found that these different features weren’t necessarily linked (as shown by the examples below), which suggests that seizure pathways and durations can be altered by different mechanisms.
My contributions
My PhD research involved independent projects under the guidance of my supervisor. I undertook the analyses, communicated the results in papers and presentations, and drove the research directions. Throughout the projects, I incorporated feedback from the lab and our clinical collaborators.
Data science approaches
Data wrangling: For this project, I extracted and organised seizure brain recordings, seizure metadata, and subject metadata.
Signal processing: I used signal processing techniques such as filtering to preprocess brain signals.
Network analysis: I described seizure dynamics as the time-varying functional connectivity between pairs of brain regions. Functional connectivity is a type of network that describes the similarity of pairs of time series (e.g., brain activity). I used coherence to quantify the similarity of pairs of brain signals in the frequency domain. I described each seizure’s time-varying network evolution as a pathway through the high dimensional network space.
Dimensionality reduction: I used non-negative matrix factorisation to reduce the dimensionality of the seizure networks and multidimensional scaling to visualise changes in seizure dynamics in a two dimensional space.
Time series analysis: Seizure pathways are multivariate time series. To compare these time series, I used dynamic time warping and distance metrics. Dynamic time warping stretches pairs of time series to align similar dynamics, making it a useful approach for comparing time series that evolve at different rates. For example, two seizures may spread in a similar pattern, but at different rates. Dynamic time warping allows us to recognise their similar pathway, even though they progress through the pathway at different speeds.
Non-parametric statistics: I used permutation tests to test for associations between seizure pathways and other seizure features.
Simulations and modelling: I compared the observed changes in seizure pathways to a simple model of how seizures could change over different timescales.
Clustering: I used clustering approaches such as hierarchical clustering and k-means clustering to cluster seizures based on their features, as well as cluster evaluation metrics to determine the optimal number of clusters.