Tidy Tuesday (2023)

personal project
R
Tidy Tuesday
Author

Gabrielle M. Schroeder

Published

July 1, 2023

These are my visualisations for Tidy Tuesday: a weekly R for Data Science data wrangling and visualisation challenge. Rough code for these visualisations is available on my GitHub.

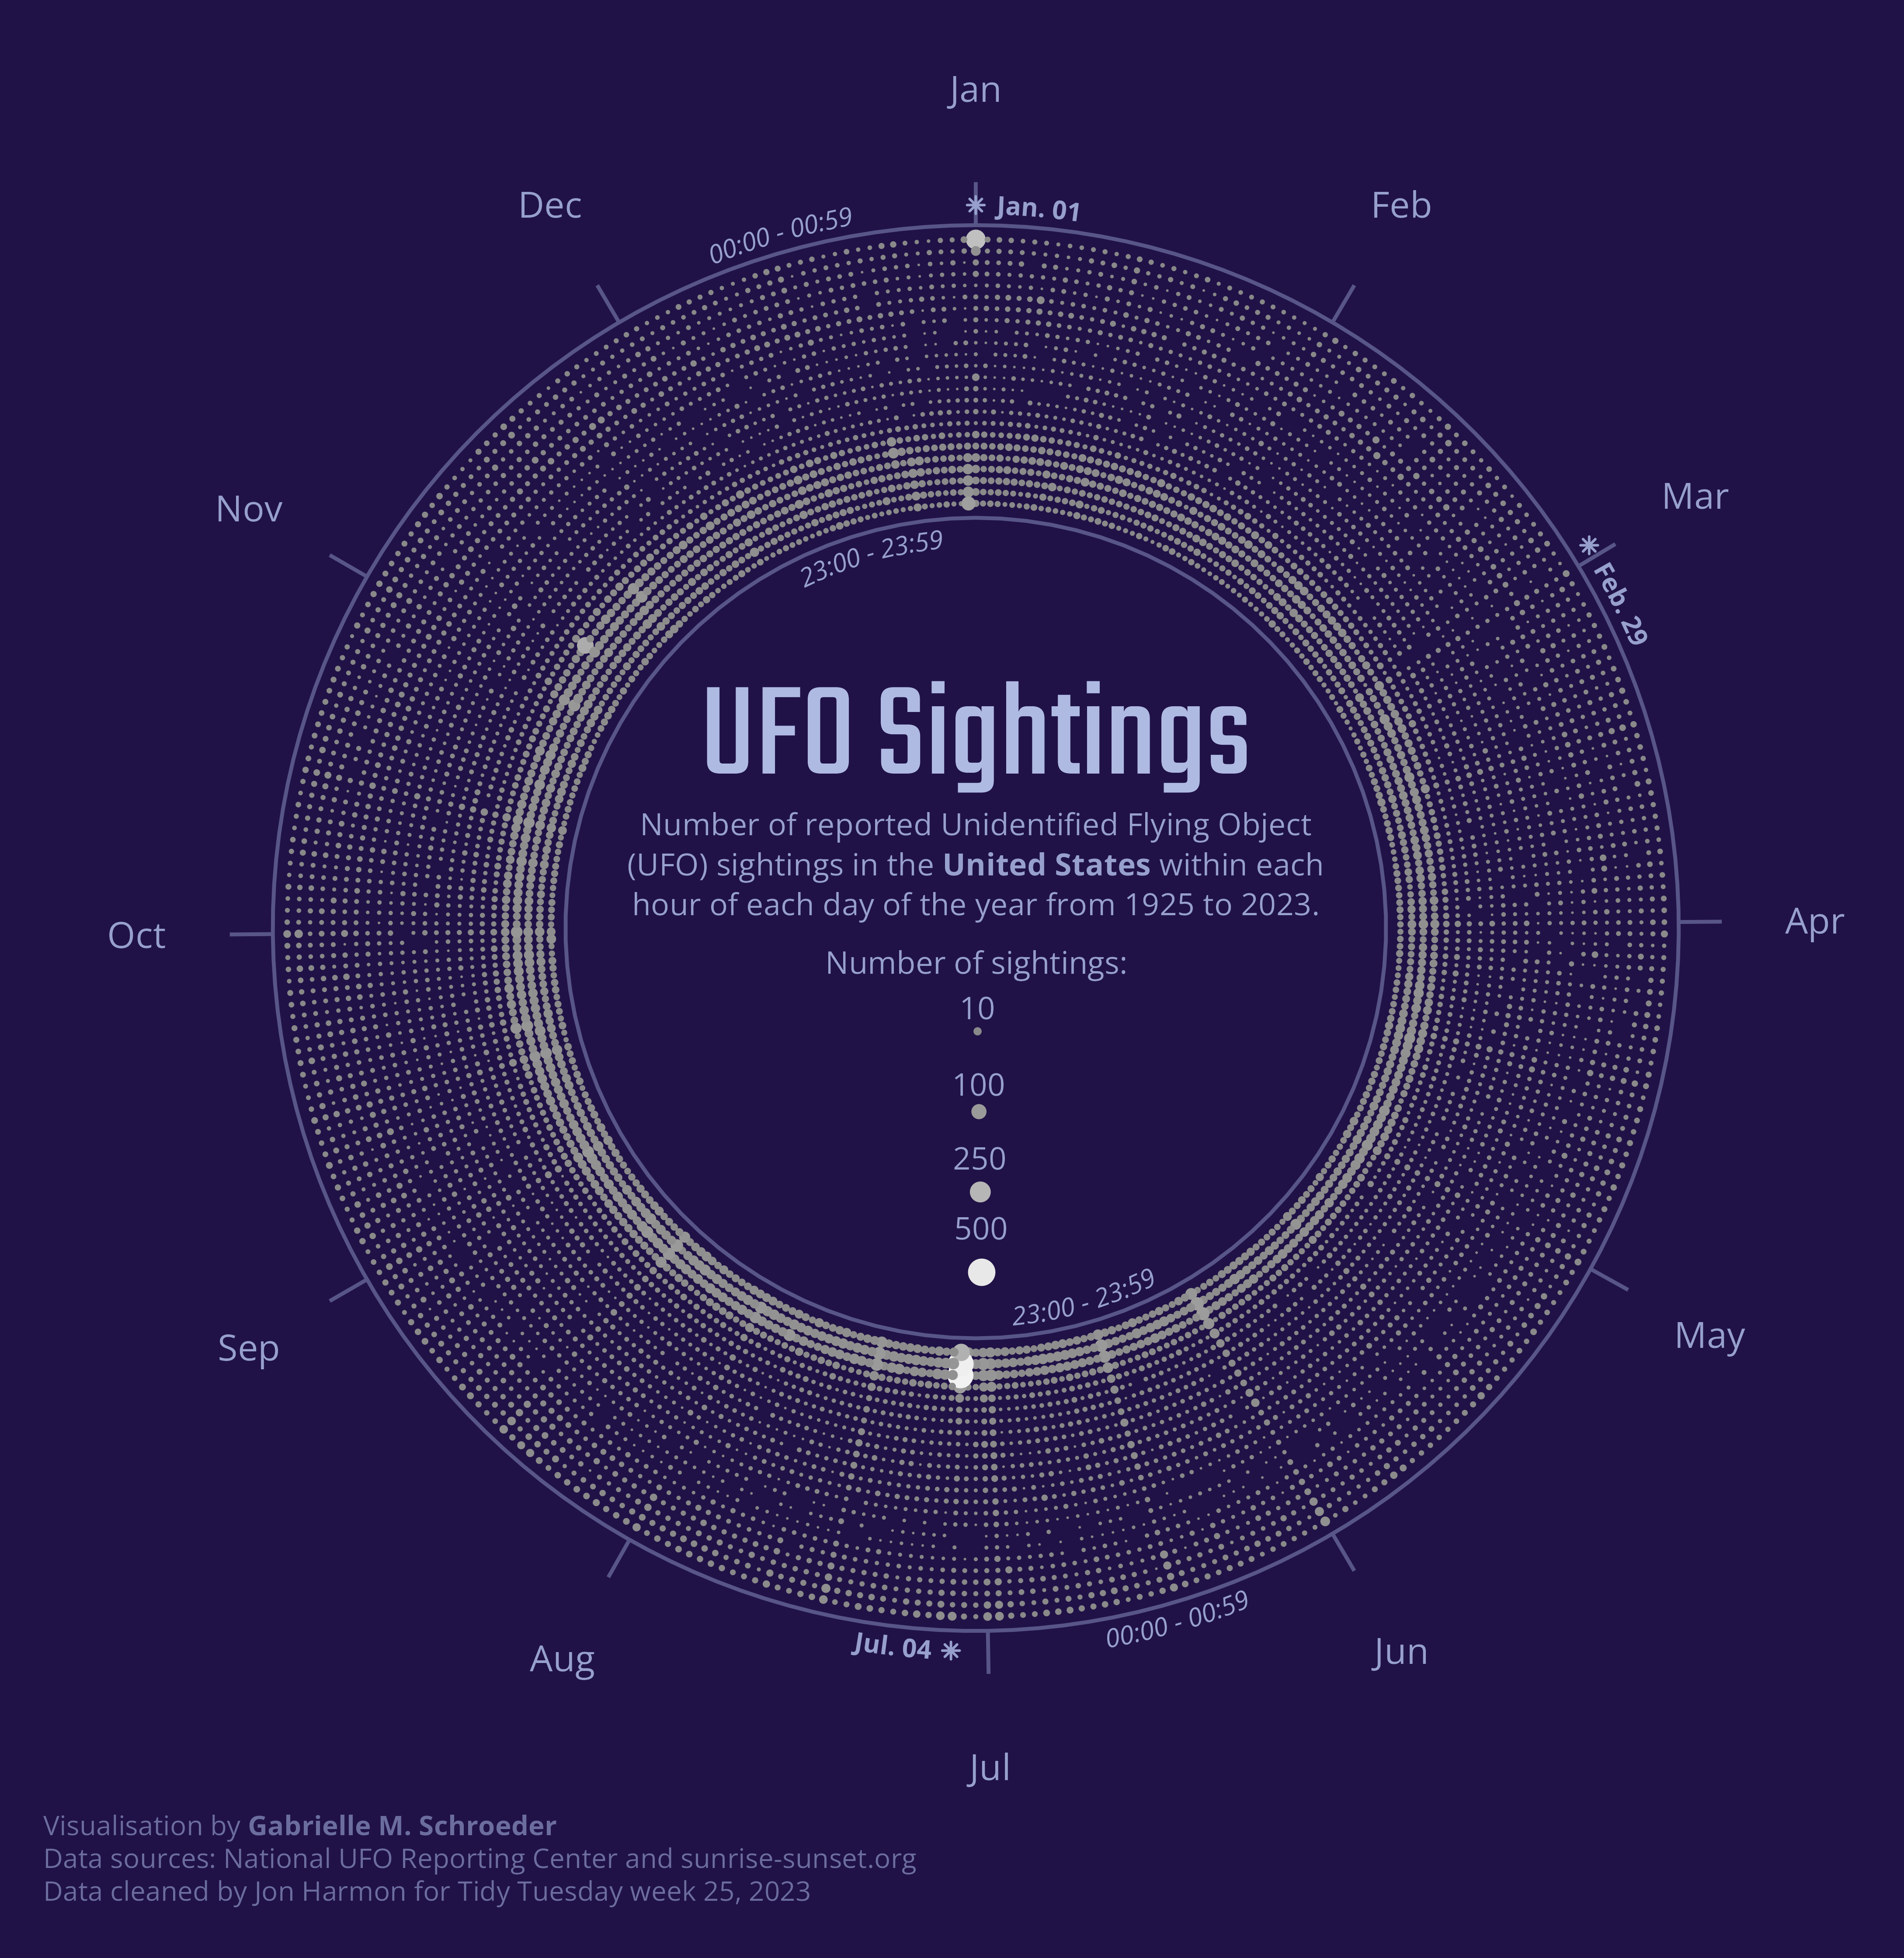
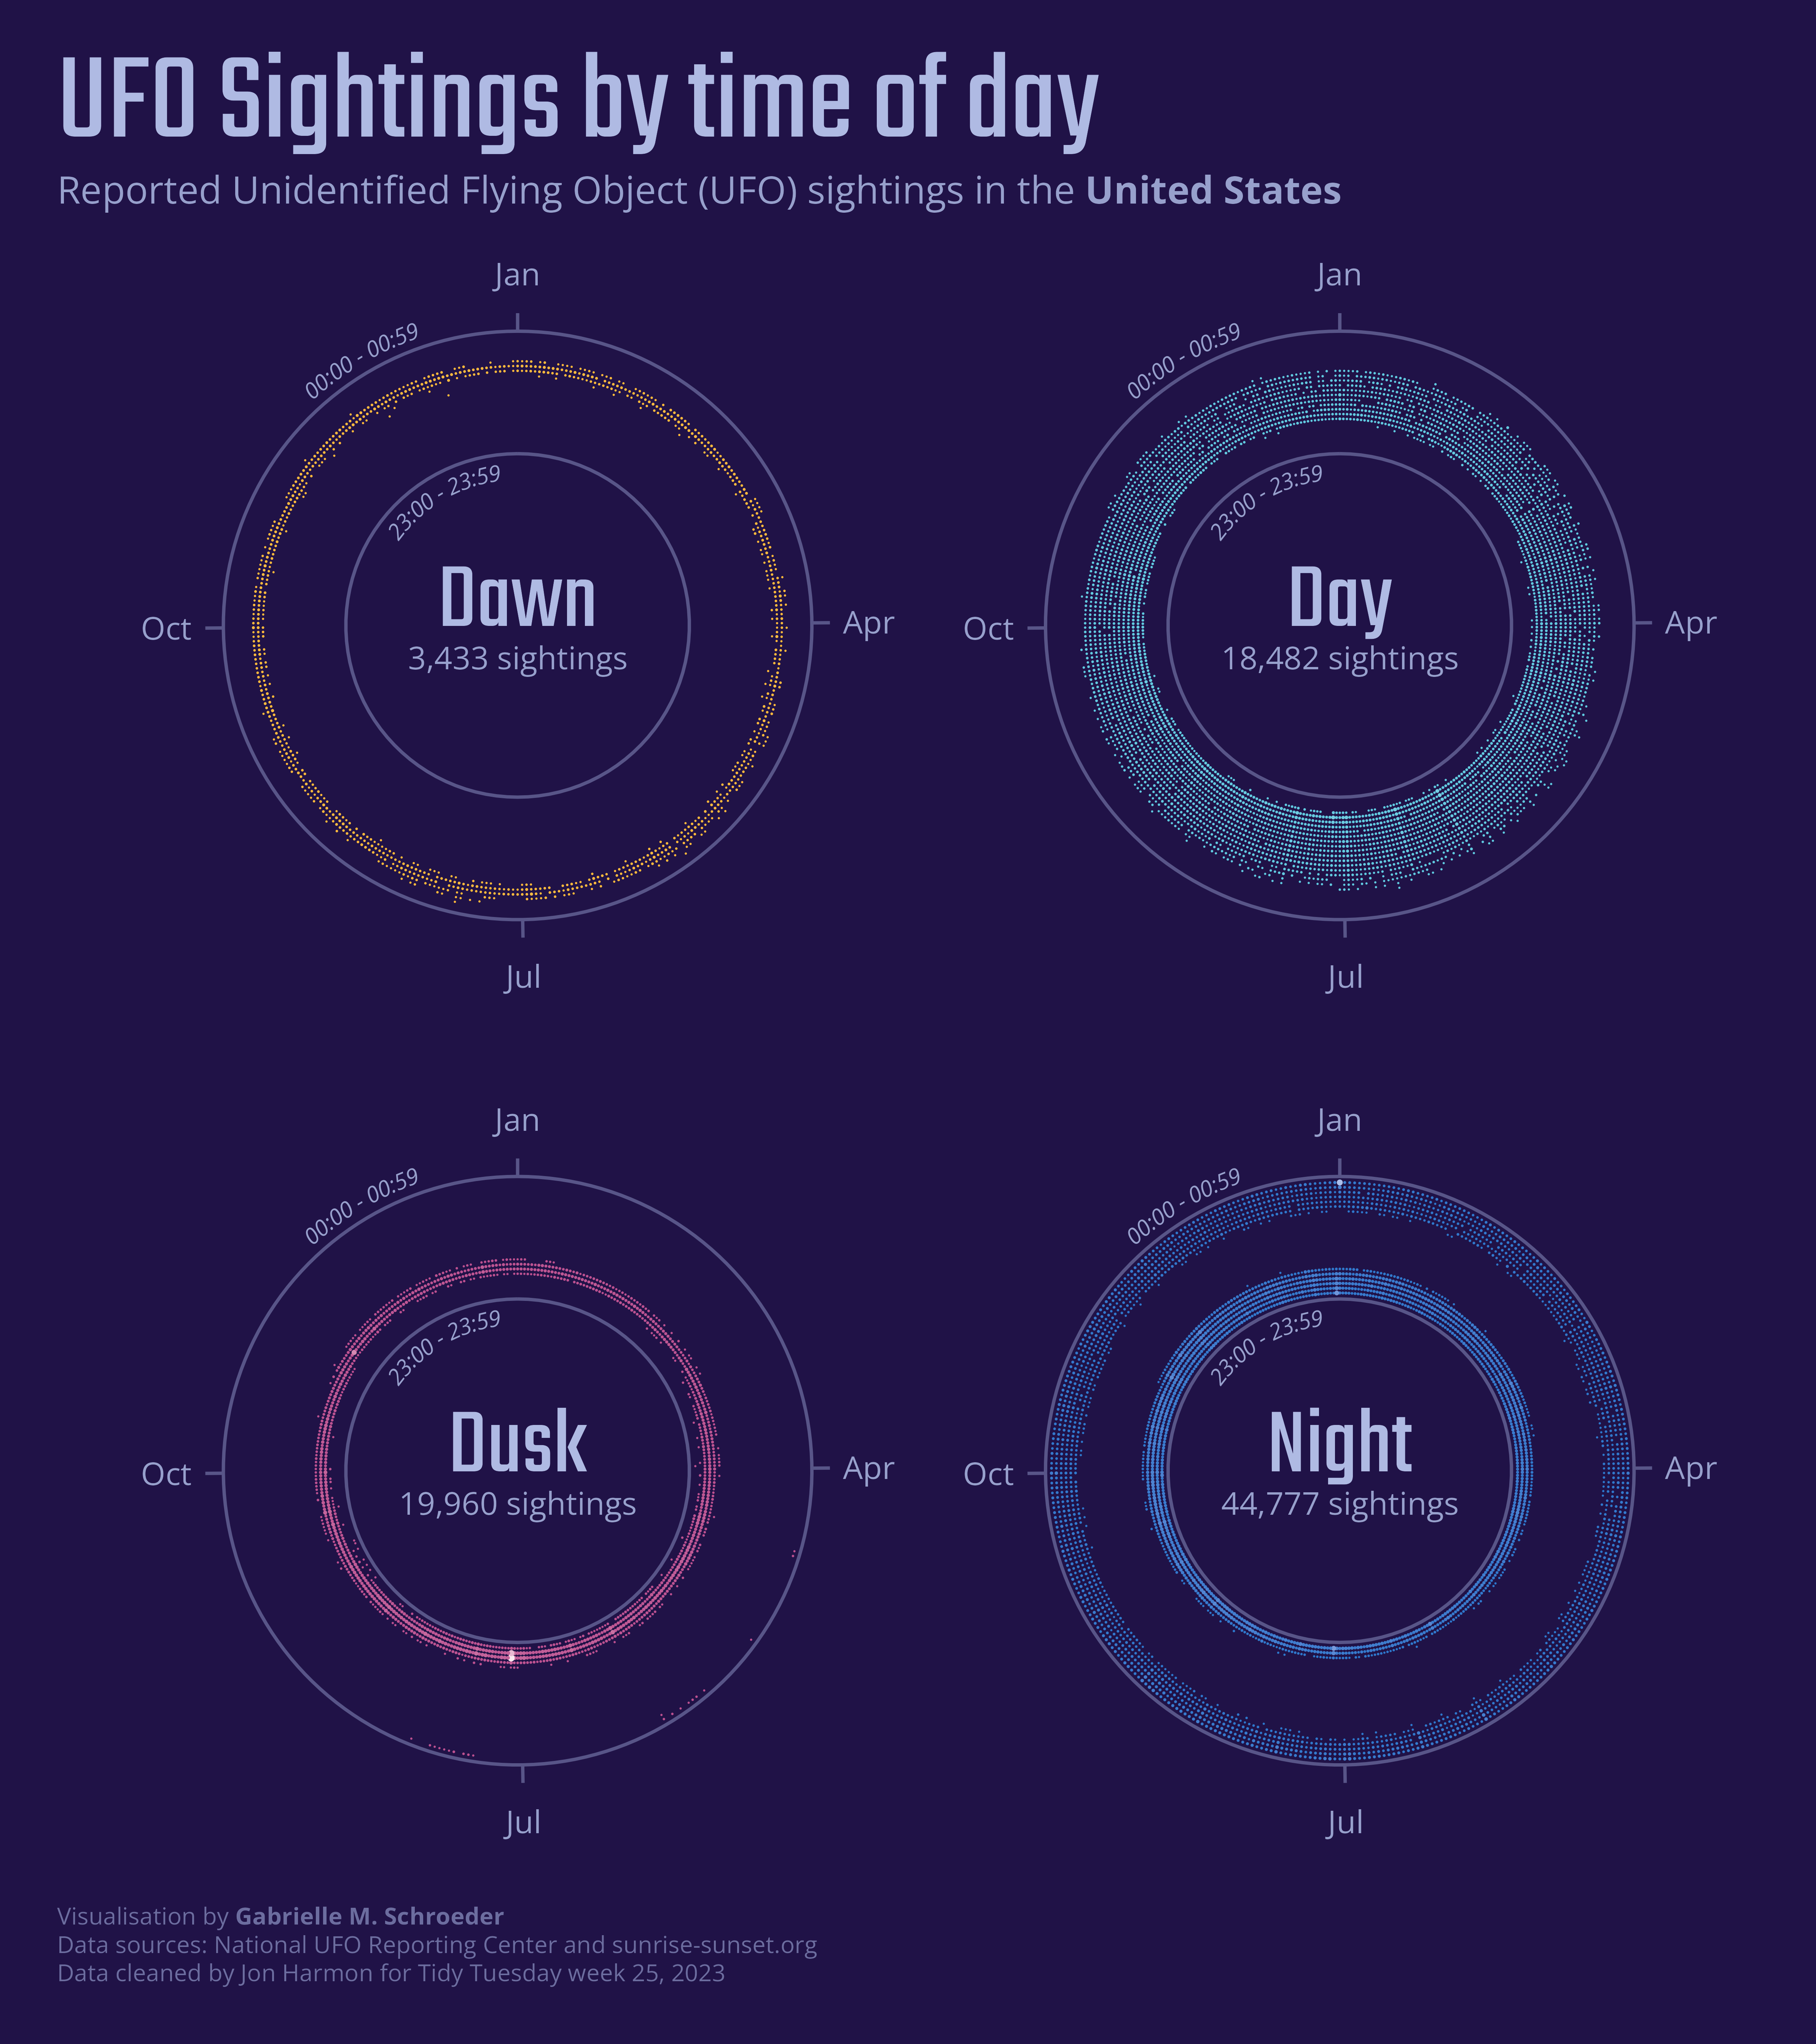
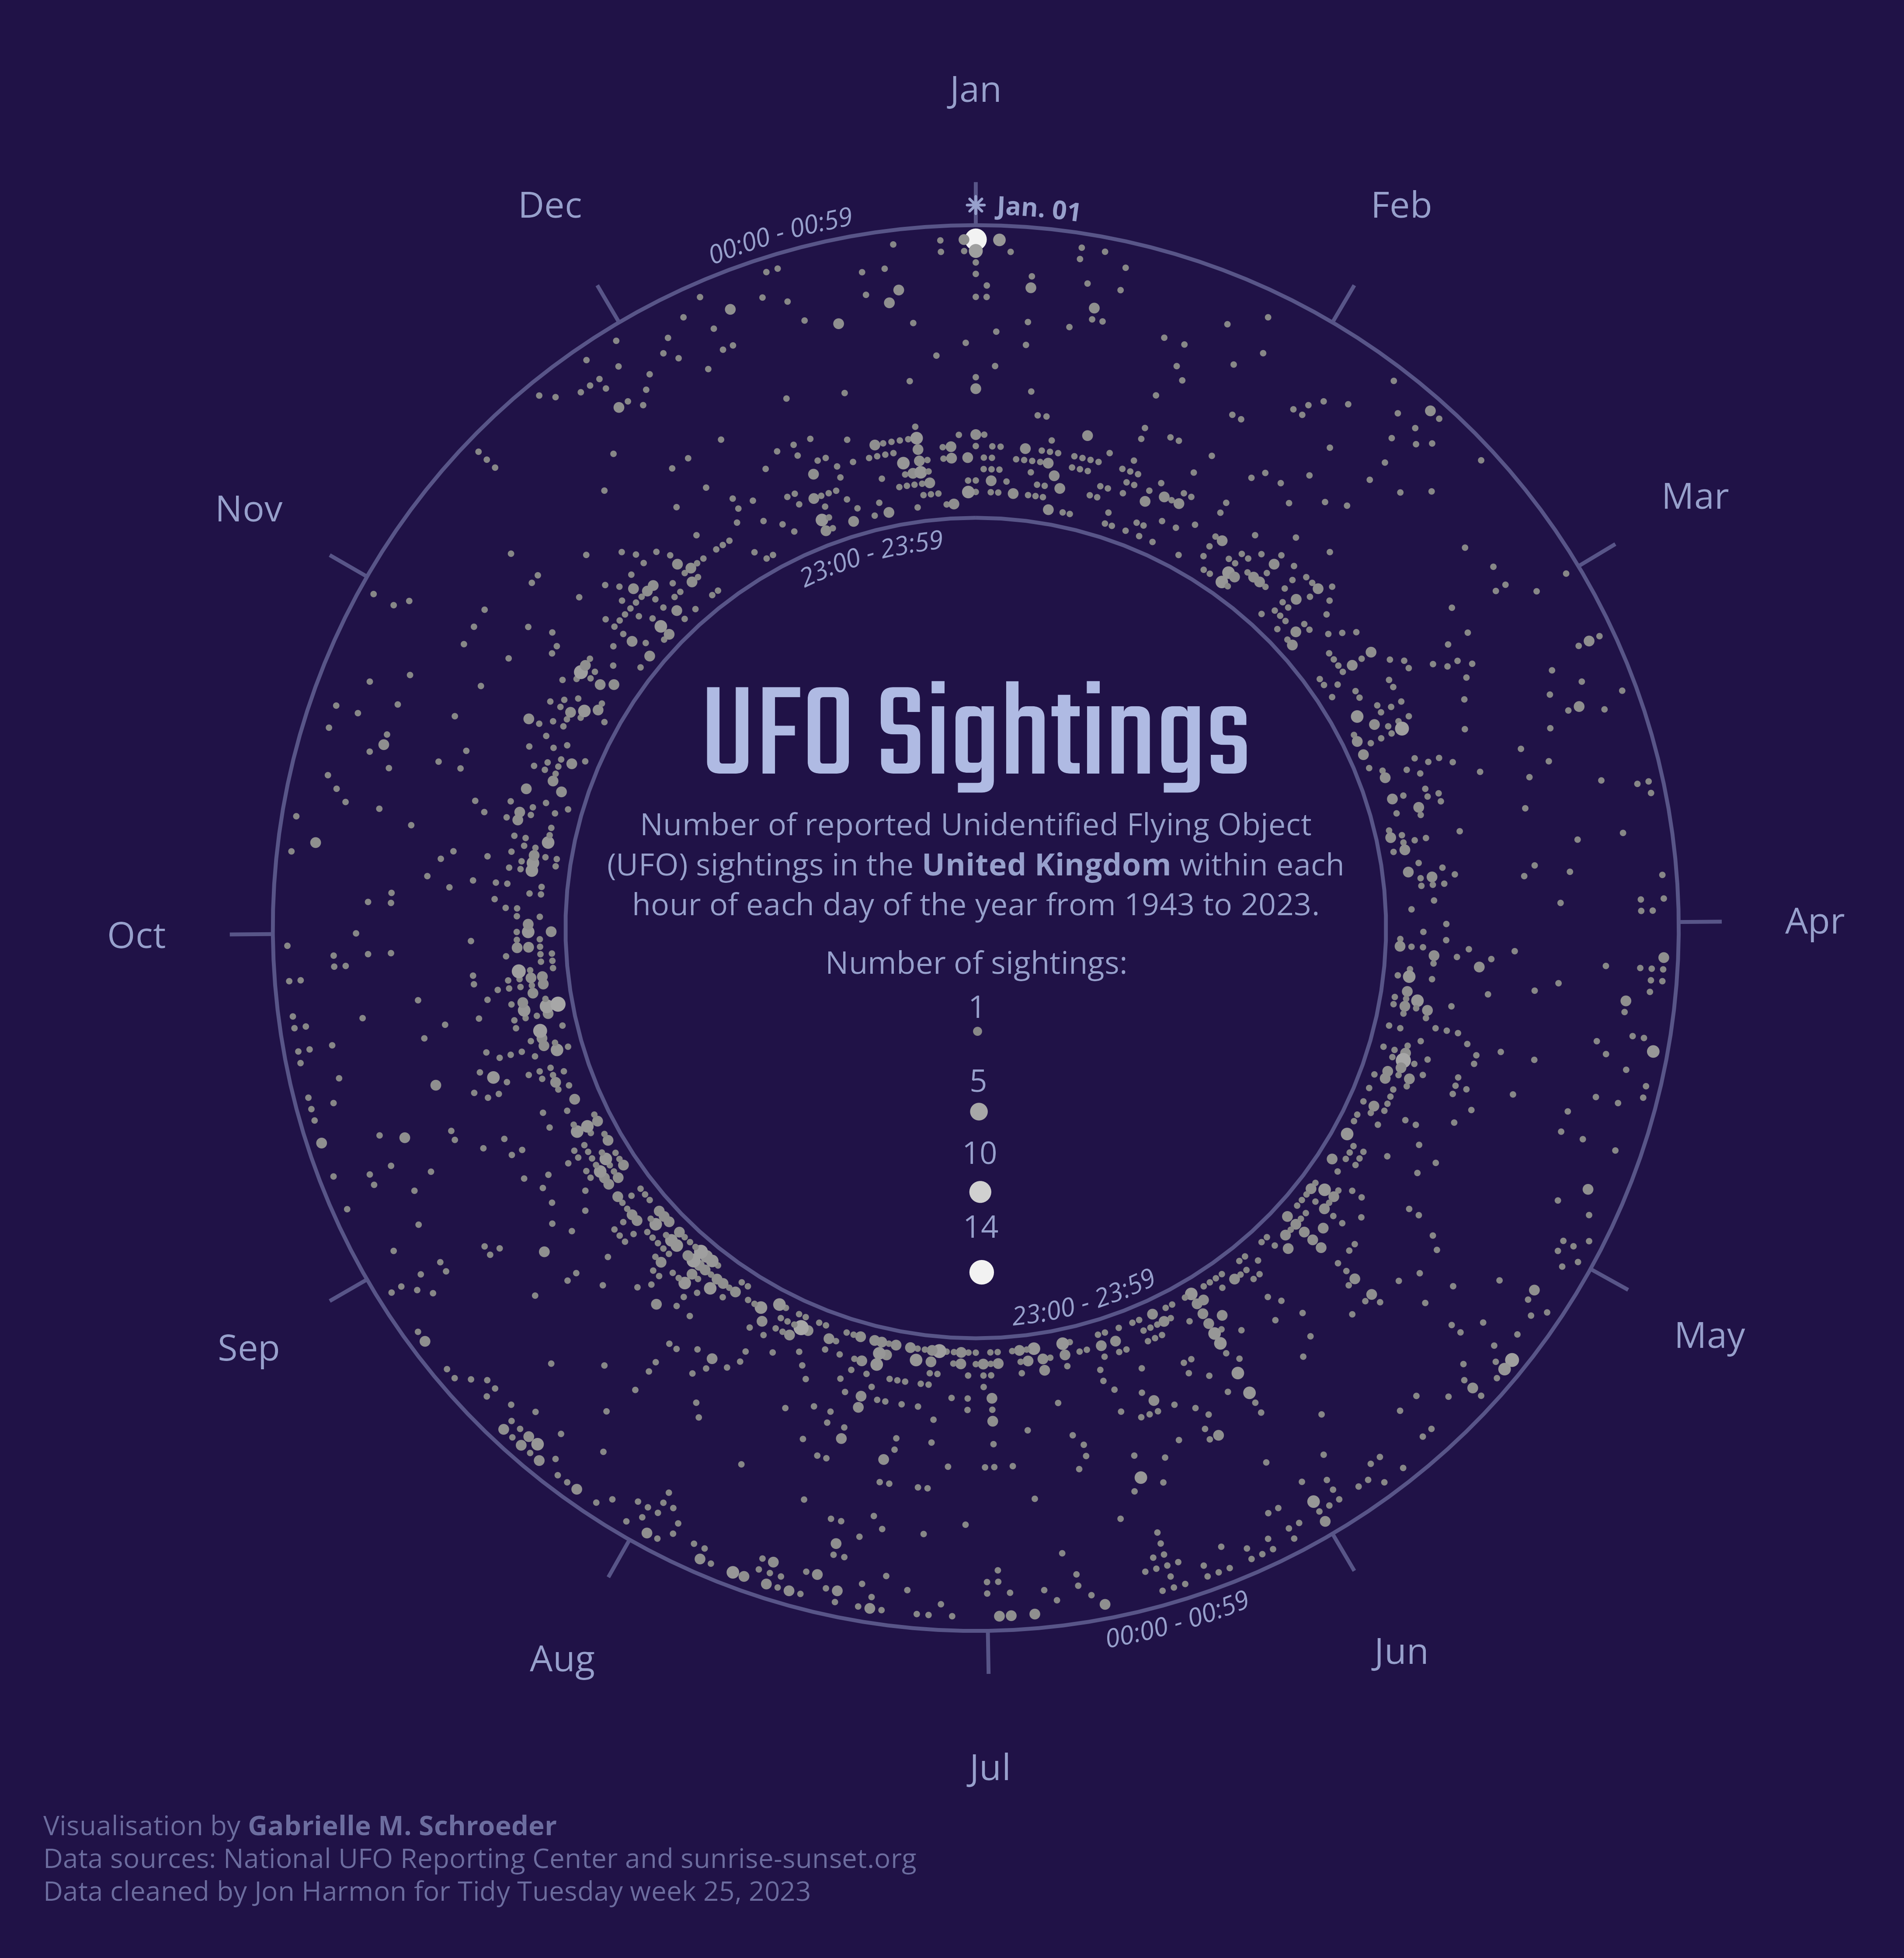
Week 25: UFO Sightings

I visualised when UFO sightings occur during the day and year. In the US, sightings tend to occur during the last few hours (during summer) or several hours (during winter) of the day, and sightings are especially common on Jan. 1 and July 4. The seasonal time-of-day variability in sightings may be because sightings tend to occur during dusk or the first part of the night.

Bubble chart of the number of UFO sightings, shown by point size, in the United States during each hour of each day in the calendar year. Polar coordinates are used to place the days of the year on a circle, creating a donut shape. Sightings are more frequent during the last few hours (during summer) or several hours (during winter) of the day, and sightings are especially common on Jan. 1 and July 4.

Four bubble charts showing the number of UFO sightings in the United States during each hour of each day in the calendar year. Each chart shows sightings that occurred during a different time of day: dawn, day, dusk, or night. Sightings occur more frequently during dusk and the first part of the night.

Fewer UFO sightings were reported in the United Kingdom, but there are still some interesting trends:

Bubble chart of the number of UFO sightings, shown by point size, in the United Kingdom during each hour of each day in the calendar year. Polar coordinates are used to place the days of the year on a circle, creating a donut shape. Sightings are more frequent during the last few hours (during summer) or several hours (during winter) of the day, and sightings are especially common in the first hour of Jan. 1.

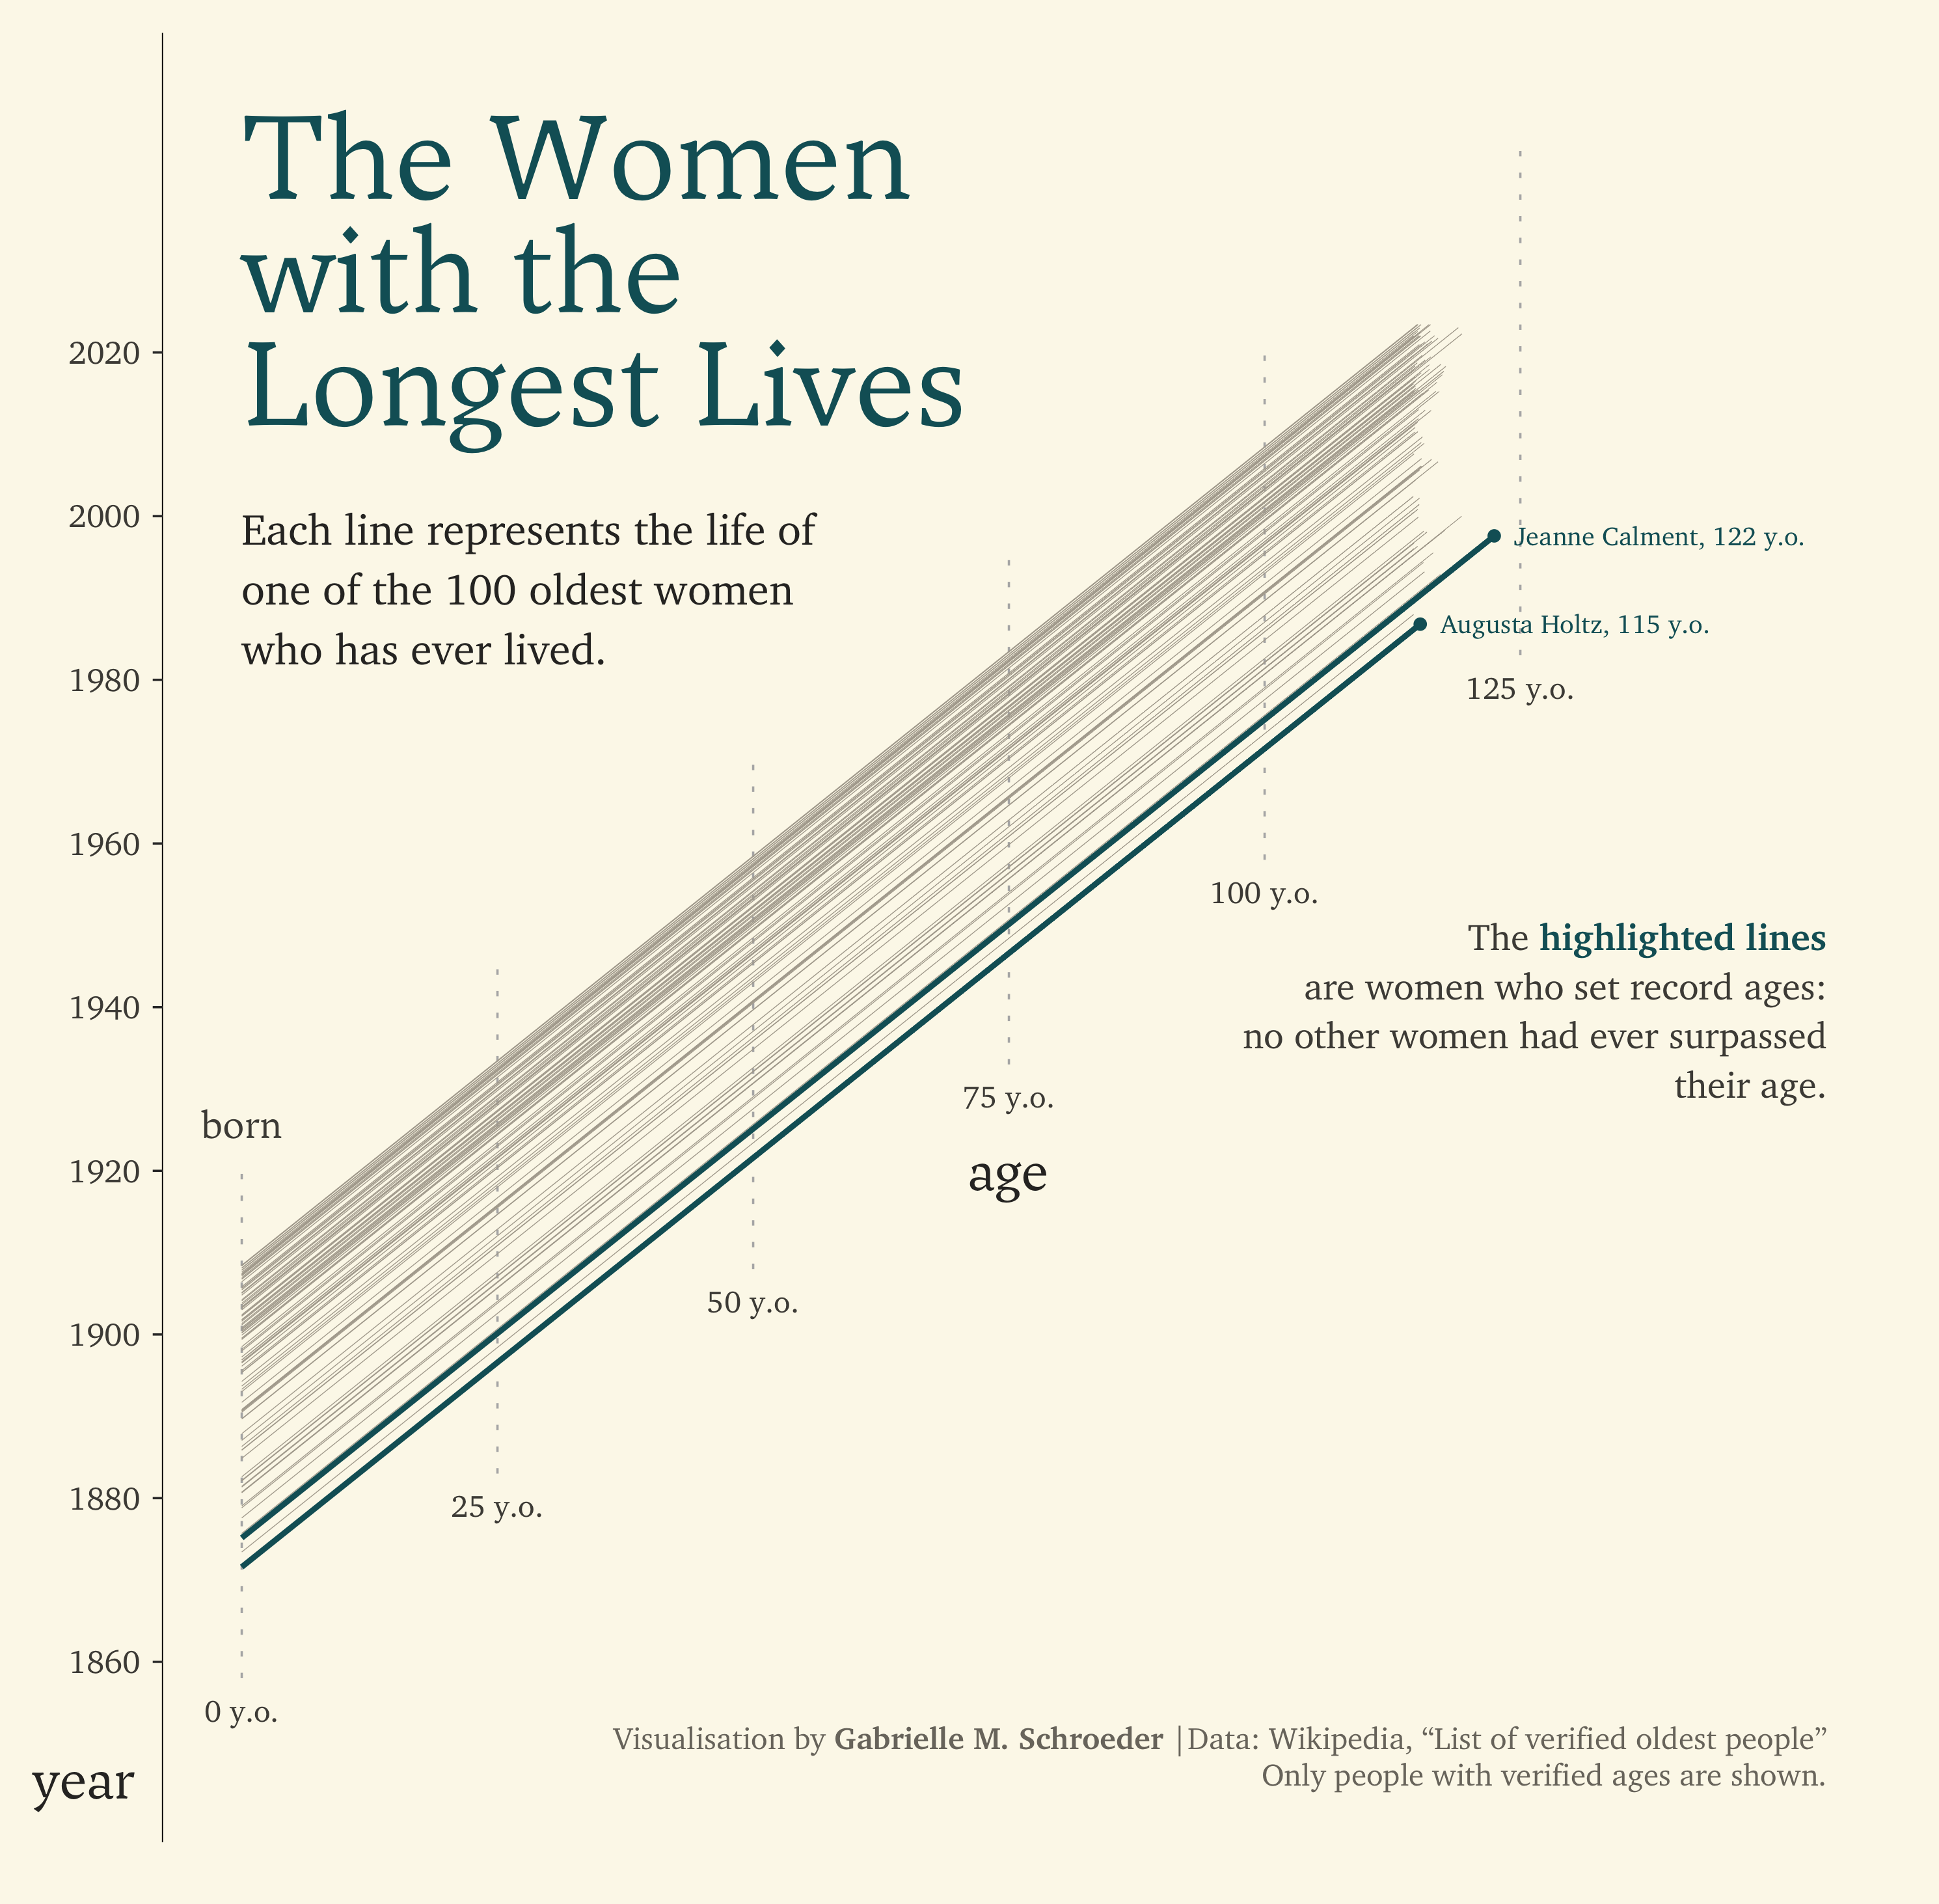
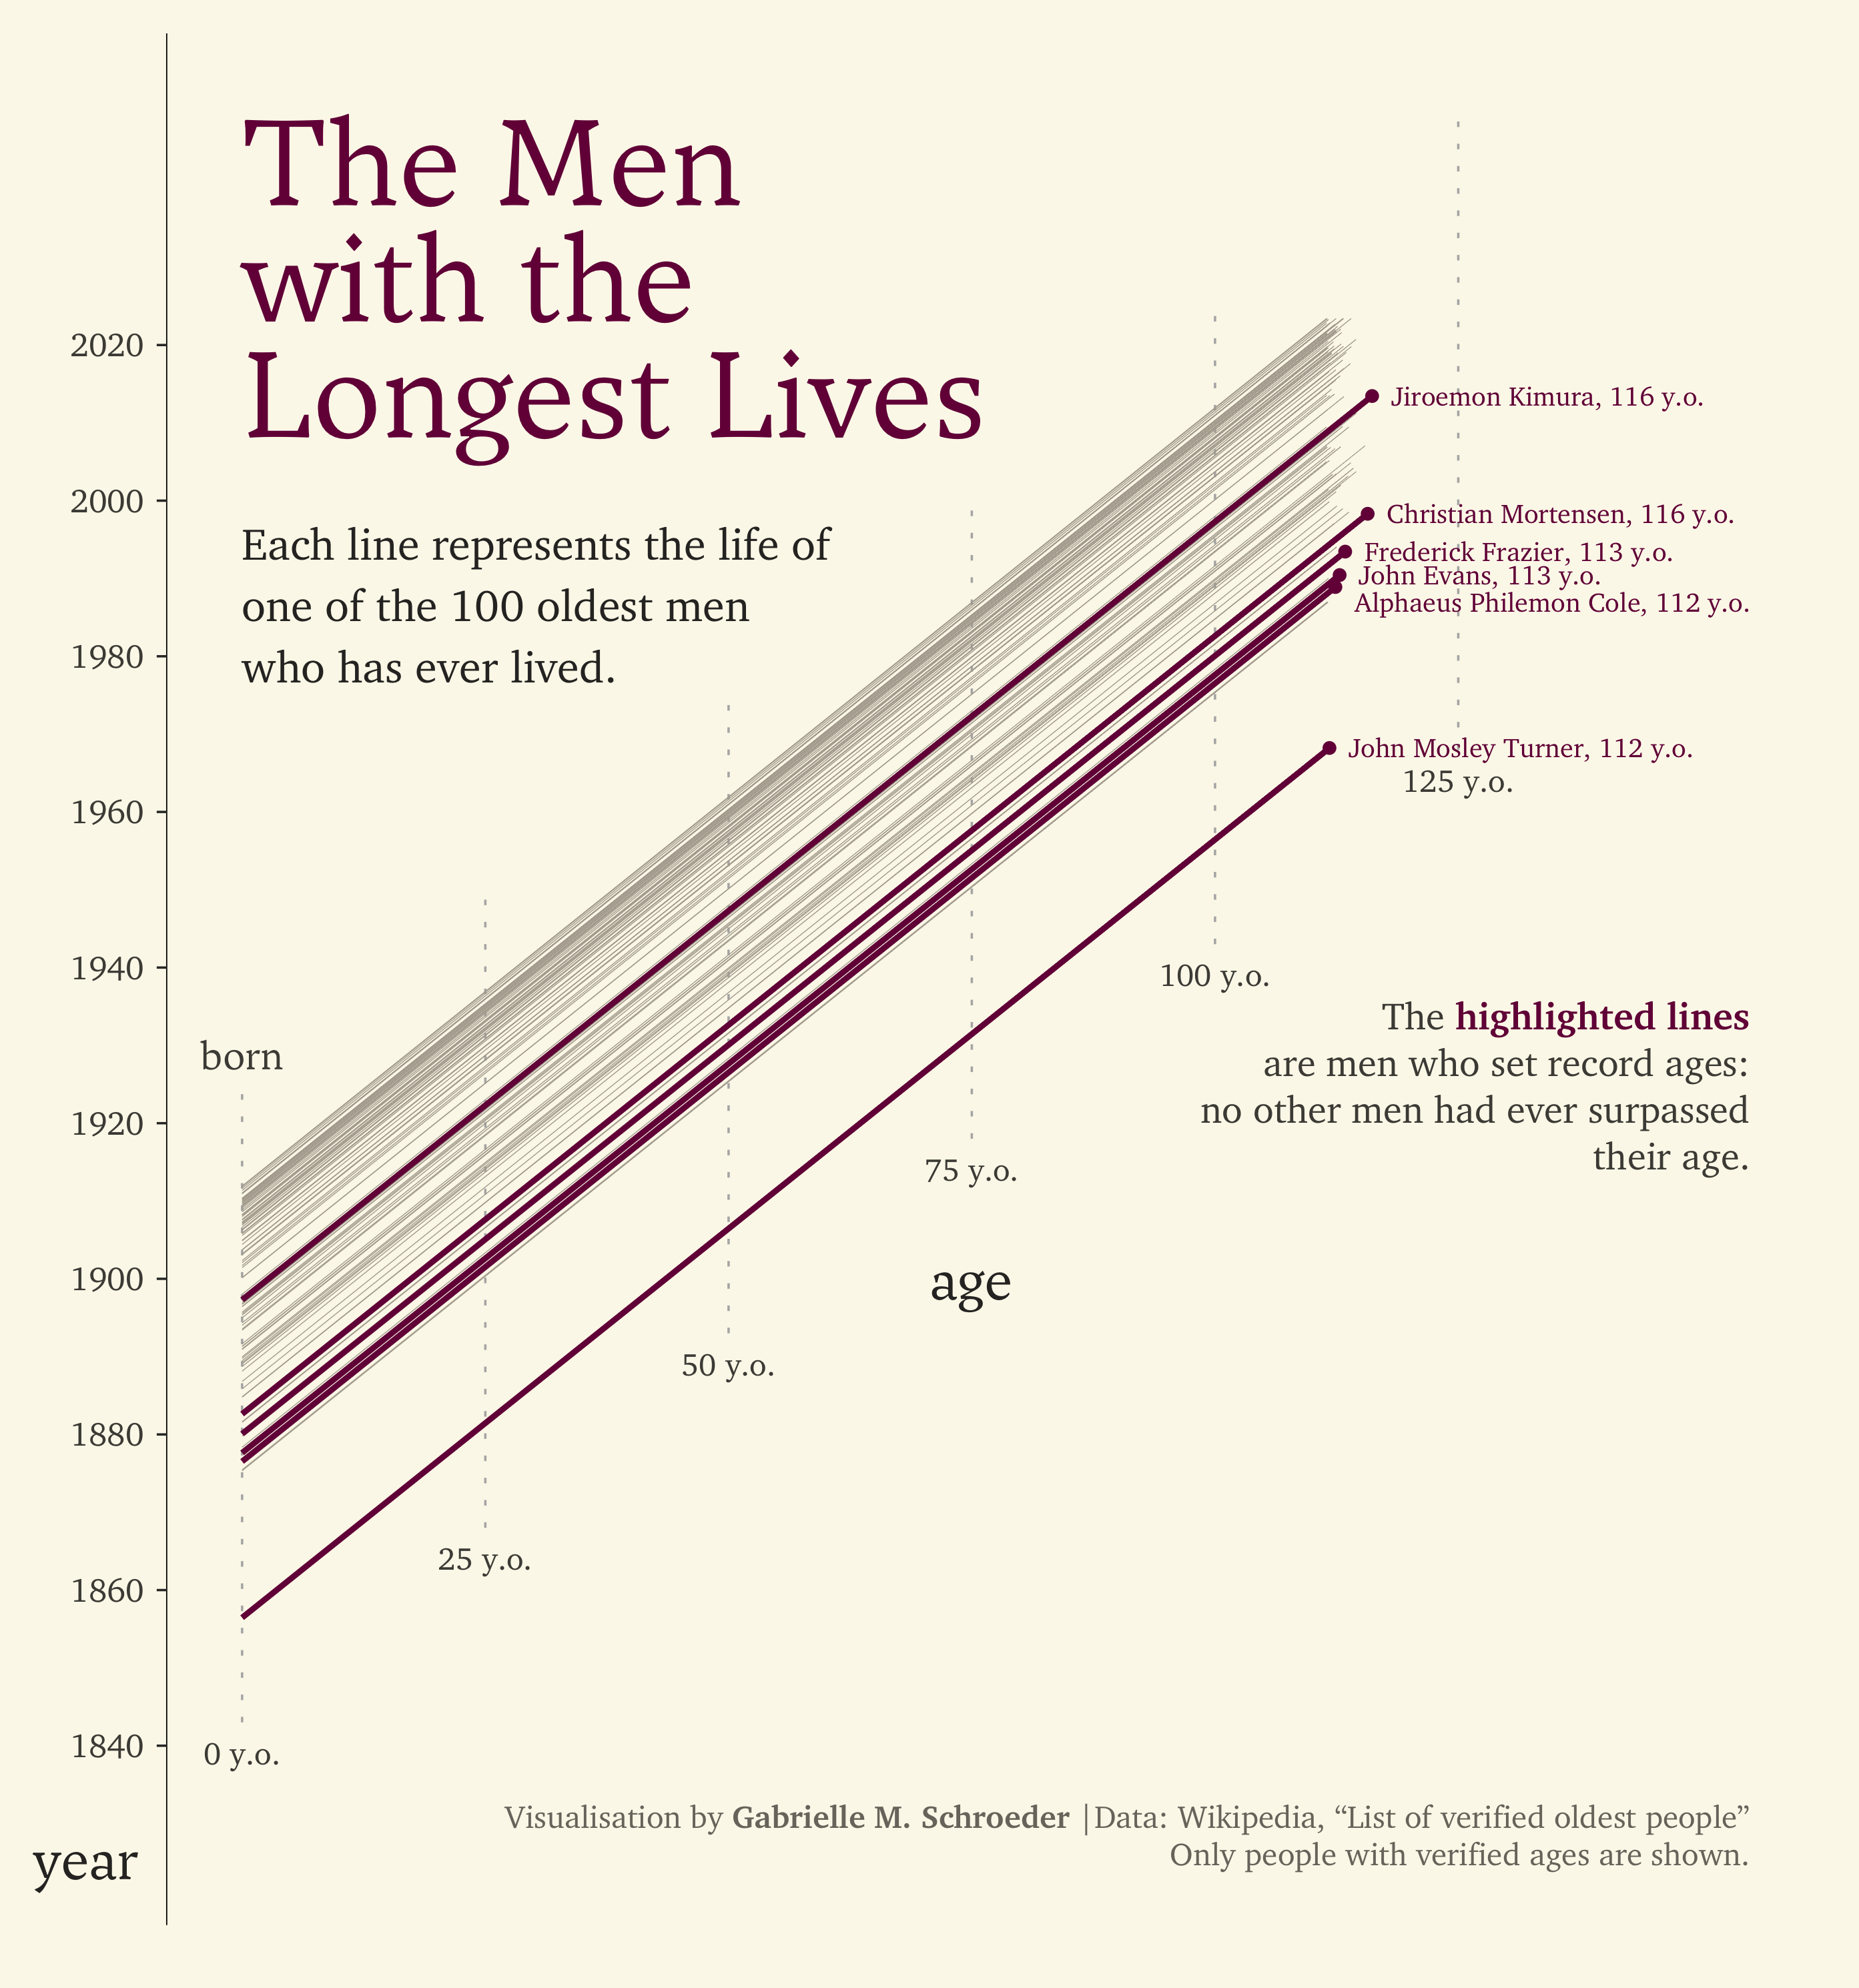
Week 22: Verified Oldest People

I visualised the years the oldest men and women lived and highlighted the people who set record ages.

Visualisation of the lives of the 100 verified oldest women who have ever lived. The dates each woman lived are plotted versus their ages on each date, creating 100 diagonal lines representing the 100 lives. The lines of the two women who set record ages (at the time of their death) are highlighted in blue. The oldest women who ever lived is Jeanne Calment, who died in 1997 at 122 years old.

Visualisation of the lives of the 100 verified oldest men who have ever lived. The dates each man lived are plotted versus their ages on each date, creating 100 diagonal lines representing the 100 lives. The lines of the six men who set record ages (at the time of their death) are highlighted in purple. The oldest man who ever lived is Jiroemon Kimura, who died in 2013 at 116 years old.